Coil Matrix Pro - Advanced Data Acquisition System
Project Overview
Coil Matrix Pro is a professional desktop application built with WinUI 3, specifically designed for coiled tubing operations in the oil & gas industry. The application provides a comprehensive solution for real-time sensor monitoring, data recording, chart visualization, and report export in Excel and PDF formats.
The application integrates with Opto 22 SNAP UP1 ADS hardware for sensor data acquisition with various signal types (Digital Encoder ABC, Analog Standard, Digital Magnetic Pickup) and features a hardware ID-based licensing system for maximum security.
This is a proprietary software project with a private repository. This documentation focuses on system architecture and features without revealing implementation details.
Table of Contents
- Key Features
- System Architecture
- Hardware Integration
- User Interface
- Configuration Management
- Export Capabilities
- Installation & Deployment
- Security Features
- Database Schema
- Performance Optimization
- Troubleshooting
- Future Enhancements
Key Features
🎯 Real-time Sensor Monitoring
- Multi-sensor support: CT Speed, CT Depth, Wellhead Pressure, Fluid Rate, Fluid Stage
- Live data polling: Configurable interval (default 100ms)
- Connection status: Real-time connection indicator with auto-reconnect
- Data source flexibility: Support for hardware device (Opto 22) and dummy simulation mode
📊 Advanced Visualization
- Gauge Charts: Circular gauges for monitoring critical parameters with warning/critical zones
- Line Charts: Multi-axis time-series charts with custom color palette
- Fullscreen Mode: Dedicated fullscreen view for operational monitoring
- Main Display: Customizable box view with real-time value updates
💾 Data Recording & Playback
- Recording Controls: Start, Stop recording with automatic timestamps
- Playback Feature: Play, Pause, Stop for historical data review
- Speed Control: Adjustable playback speed (1x, 2x, 5x, 10x)
- Database Storage: SQLite for efficient local data storage
📋 Configuration Management
- Device Configuration: Setup Opto 22 SNAP connection (IP, Port, Timeout)
- I/O Device Setup: Configure signal types and pin addresses for each sensor
- Encoder Configuration: PPR (Pulses Per Revolution) and Gear Ratio settings
- General Data: Customer info, well information, location, service data
- Chart Setup: Custom gauge and line chart configurations with color picker
📤 Export Capabilities
- Excel Export: ClosedXML integration for exporting readings with custom formatting
- PDF Reports: QuestPDF for generating professional chart reports
- Flexible Options:
- All readings vs current record only
- Chart report vs list/table report
- Custom column selection
- Auto-generated filenames with timestamps
🔐 Hardware License Validation
- Hardware-based Protection: License tied to unique hardware ID
- Anti-crack Strategy: Multi-layer validation system
- Installation Key: Secure key generation for installation
- Offline Operation: No internet connection required after activation
System Architecture
Technology Stack
Frontend Framework:
- .NET 8: Latest .NET framework for modern desktop development
- WinUI 3: Modern Windows UI framework with Fluent Design
Data Visualization:
- LiveCharts: Real-time chart rendering library
- Custom gauge implementations for industrial monitoring
Data Management:
- SQLite: Lightweight, embedded database for local storage
- Entity Framework Core for ORM
Export Libraries:
- ClosedXML: Excel file generation (.xlsx)
- QuestPDF: PDF report generation with custom layouts
Hardware Communication:
- Opto 22 SNAP Protocol: TCP/IP communication with industrial hardware
- Modbus TCP support
Packaging:
- MSIX: Modern Windows app packaging
- WiX Toolset v5 for MSI installer
- Inno Setup for traditional EXE installer
Component Architecture
The application follows a layered architecture pattern:
Presentation Layer (Views)
- Main monitoring interface
- Configuration dialogs
- Chart displays (Gauge, Line)
- Fullscreen views
Business Logic Layer (ViewModels & Services)
- Data acquisition service
- Database service
- Export service
- License validation service
- Configuration service
Data Access Layer (Models & Repositories)
- Entity models
- SQLite repositories
- Data transfer objects (DTOs)
Hardware Integration Layer
- Opto 22 SNAP communication
- Device abstraction interfaces
- Dummy data simulator
Data Flow Diagram
- Data Acquisition Flow:
- Hardware device → Communication service → Data processing → Storage
- Dummy simulator → Data generation → Storage
- Monitoring Flow:
- Database → Data retrieval → ViewModel → Live updates → UI components
- Export Flow:
- Database query → Data formatting → Export library → File generation
Hardware Integration
Opto 22 SNAP UP1 ADS
The application is designed to integrate with Opto 22 SNAP UP1 ADS, an industrial-grade data acquisition system that supports:
Communication Protocol:
- Ethernet/IP
- Modbus TCP
- TCP/IP with configurable port (default 2001)
Signal Types:
- Digital (Encoder ABC): For speed & depth measurement
- Quadrature encoder support
- A, B, A Complement, B Complement channels
- Configurable PPR (Pulses Per Revolution)
- Gear ratio settings
- Analog Standard: For pressure & flow sensors
- 4-20mA current loops
- 0-10V voltage inputs
- Configurable scaling
- Digital Magnetic Pickup: For fluid monitoring
- Frequency-based measurements
- Pulse counting
Connection Settings:
- Host/IP Address: e.g., 192.168.1.50
- Port: default 2001 (configurable)
- Timeout: 5000ms (adjustable for stability)
Sensor Configuration
Each sensor can be configured with:
- Tag name and description
- Signal type selection
- Pin address mapping
- Encoder-specific settings (PPR, Gear Ratio)
- Enable/disable toggle
User Interface
1. Splash Screen
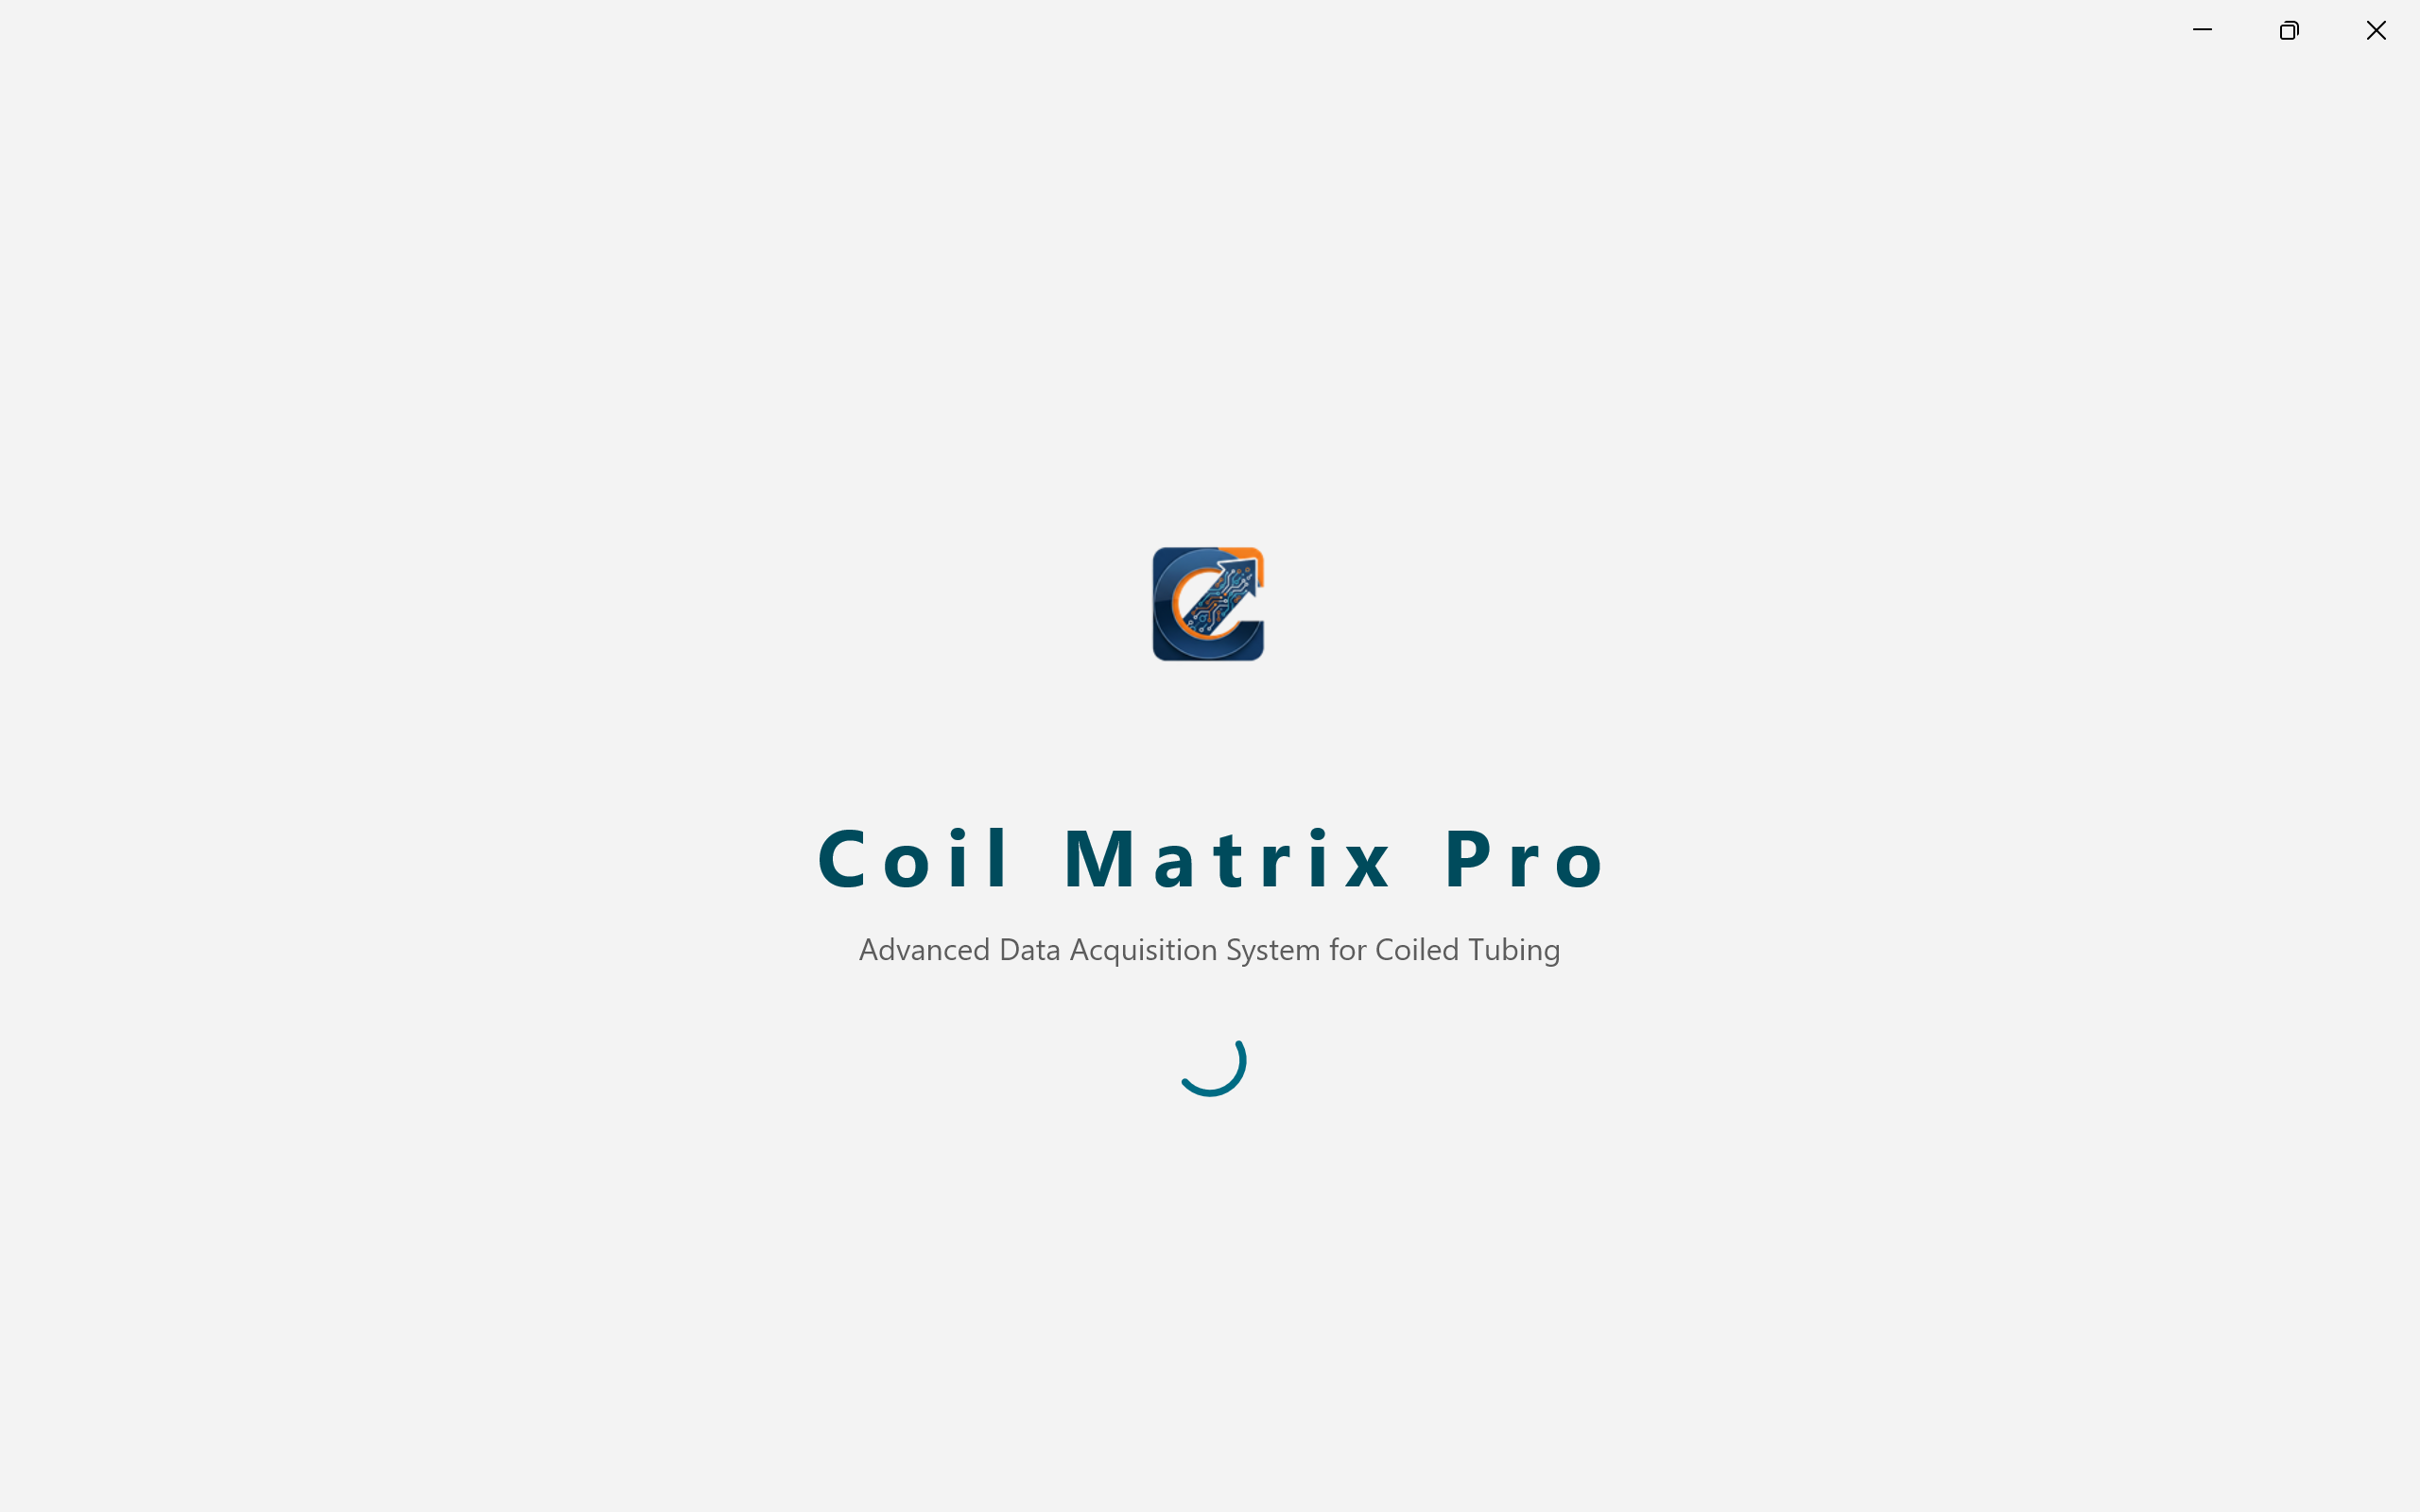
The application launches with a professional splash screen displaying:
- Application logo
- Application name and tagline
- Loading indicator
- Clean, modern design
2. Monitoring Files Management
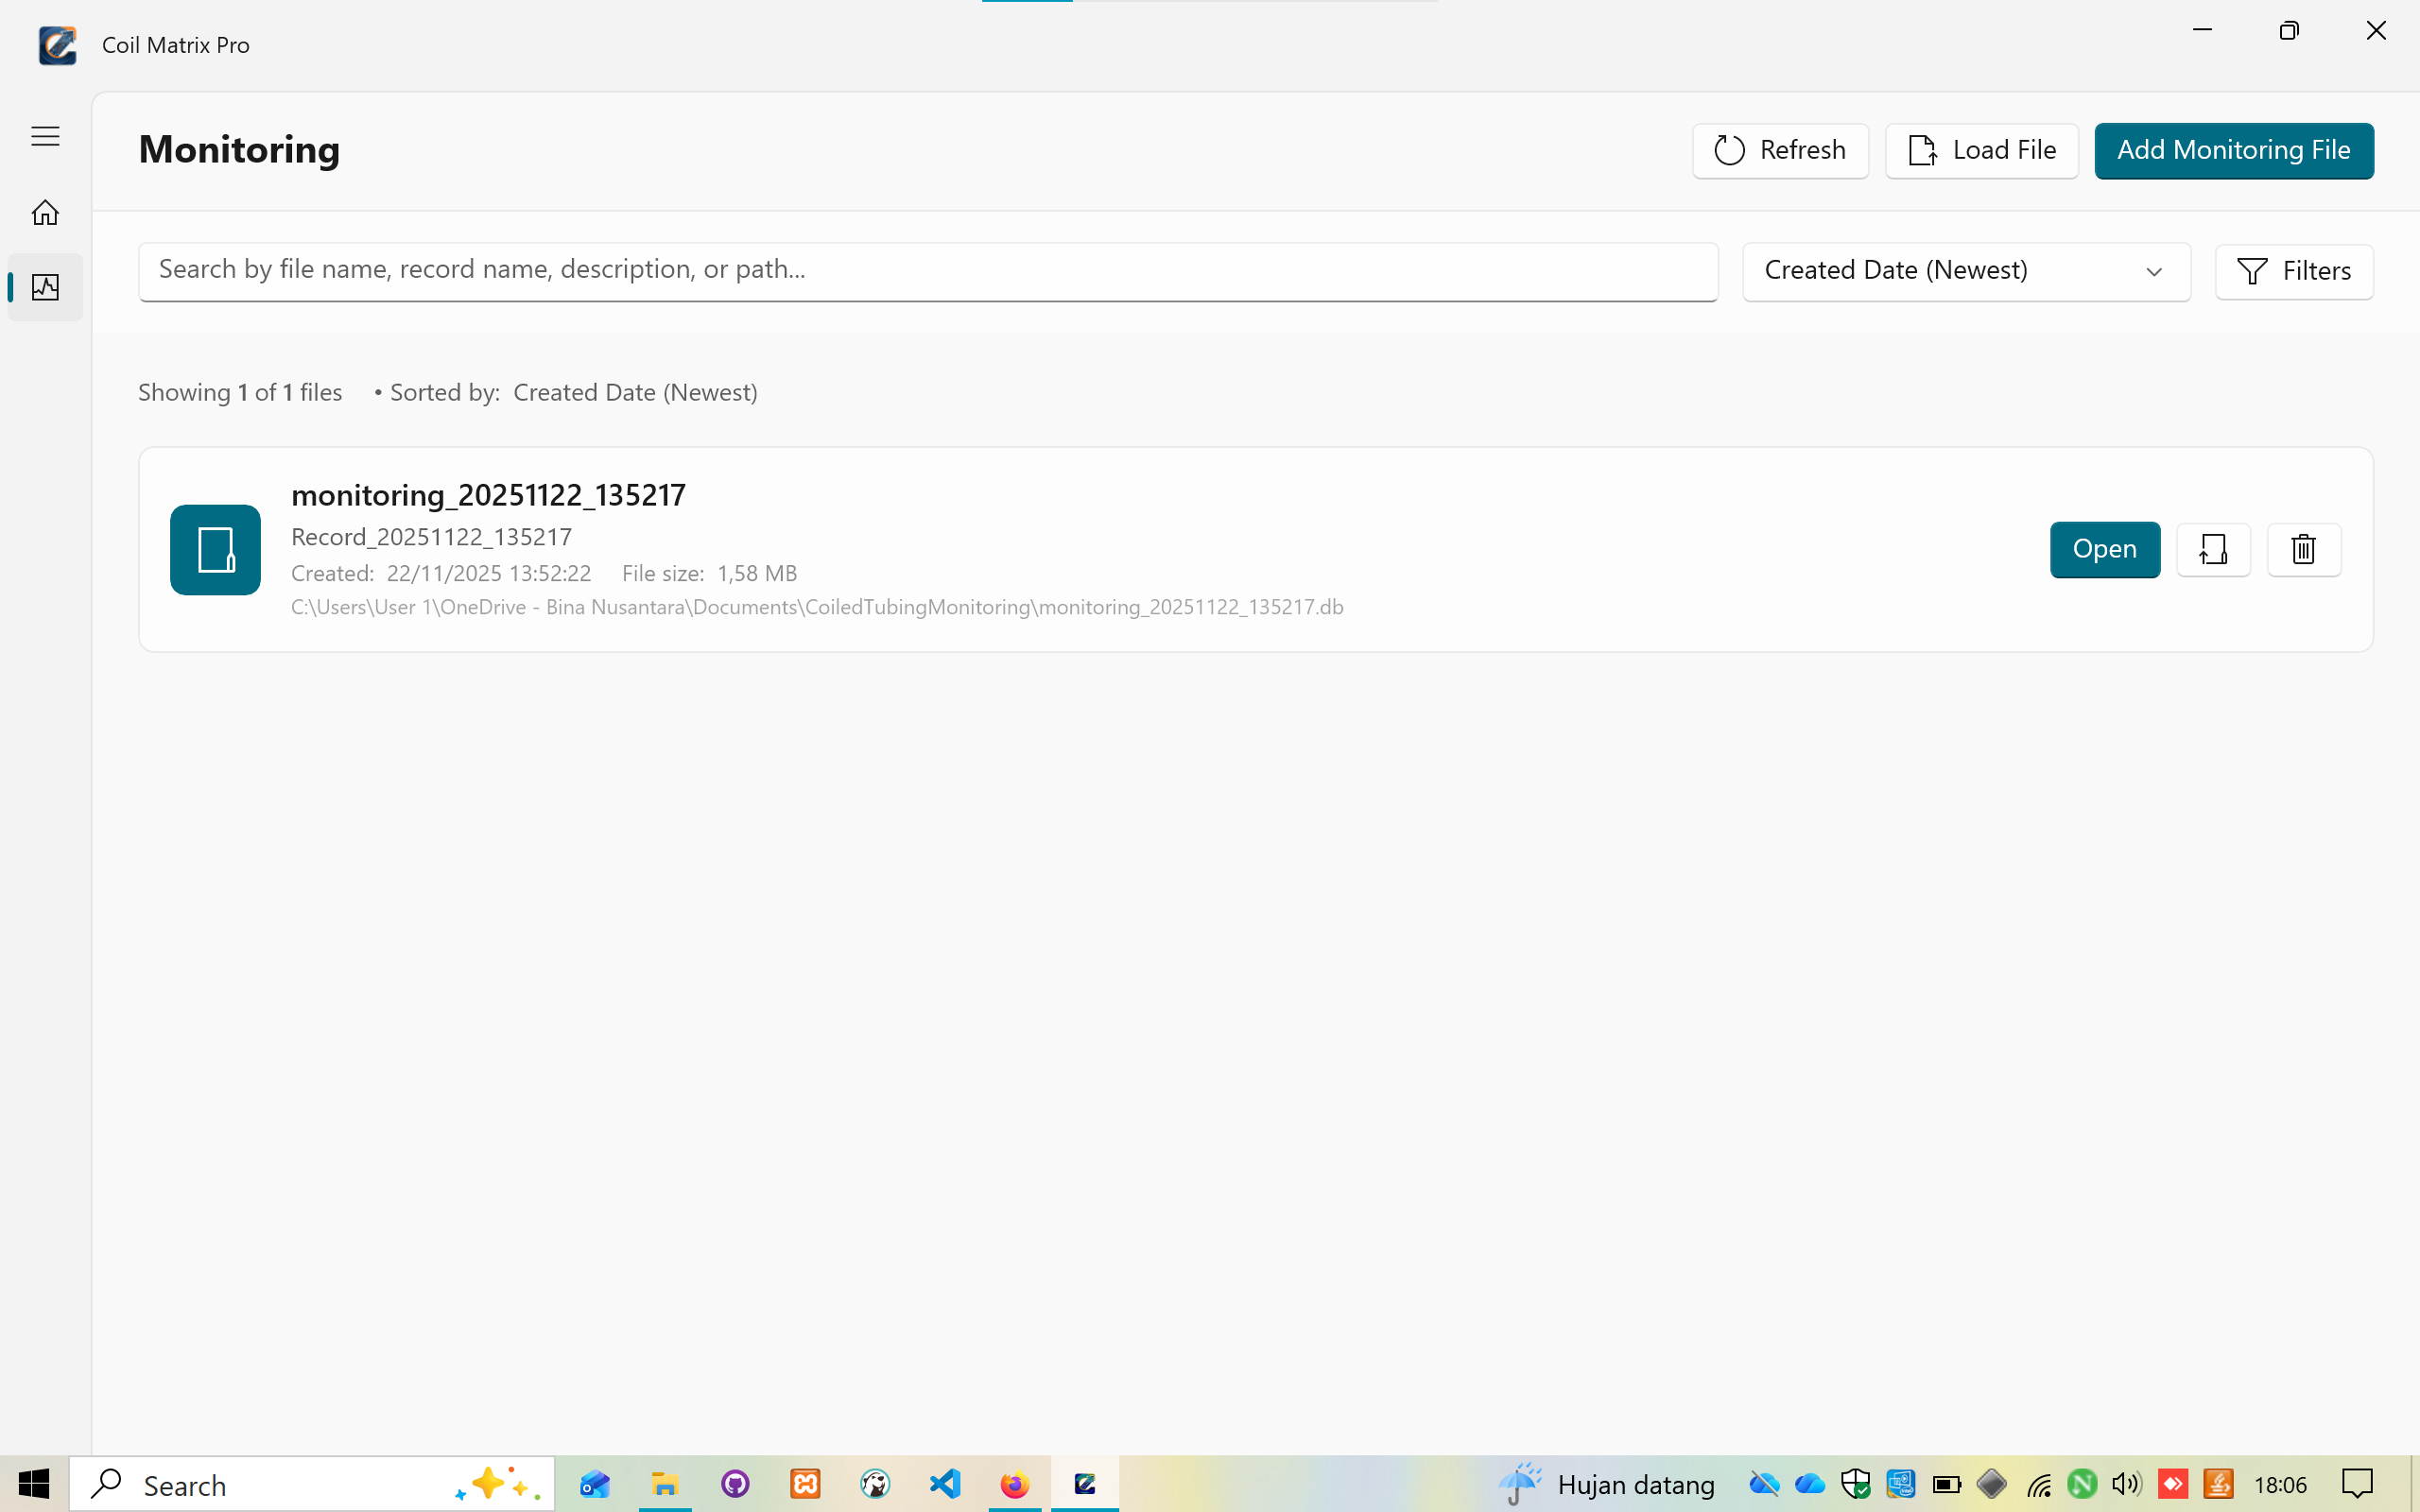
Features:
- Search functionality by file name, record name, description, or path
- Sort options (Created Date - Newest)
- Filters for advanced searching
- File information display:
- Record ID and timestamp
- File size
- Full file path
- Actions: Open, Load File, Add Monitoring File
- Refresh functionality
3. Main Monitoring Interface
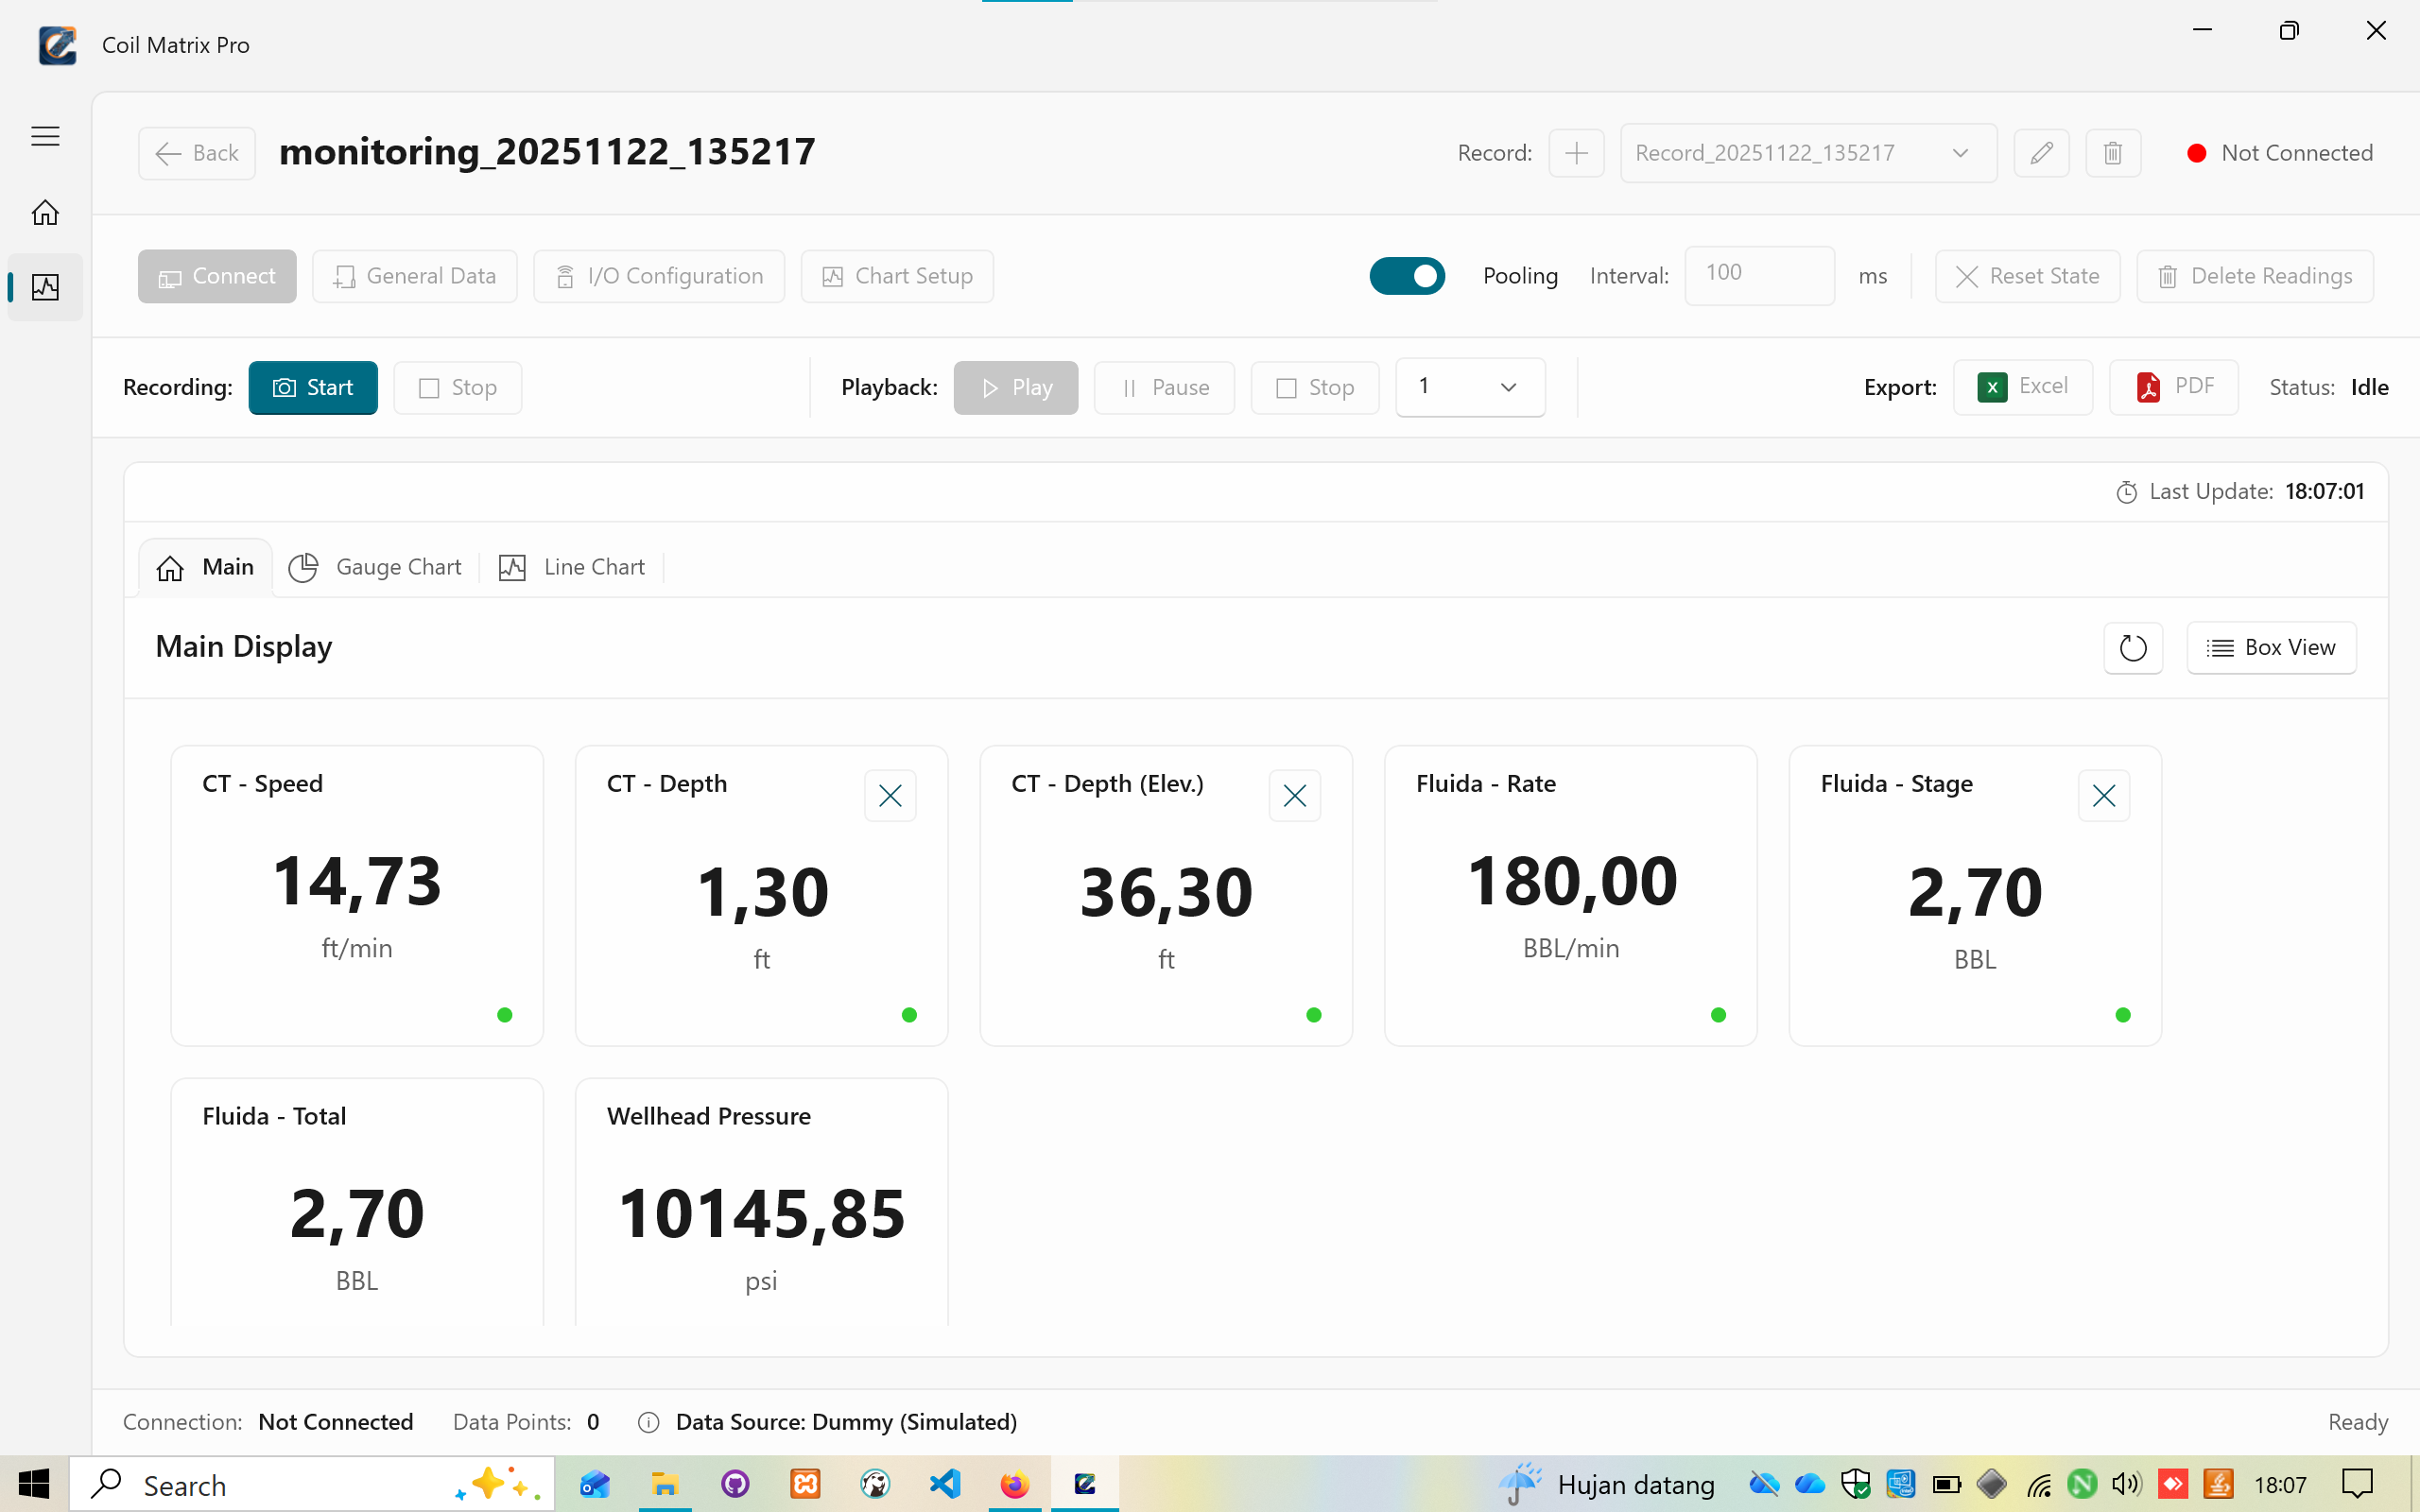
The main interface displays real-time sensor values in a card/box view:
Sensor Cards:
- CT - Speed: Coil speed (ft/min) with status indicator
- CT - Depth: Current coil depth (ft)
- CT - Depth (Elev.): Depth with elevation (ft)
- Fluida - Rate: Fluid flow rate (BBL/min)
- Fluida - Stage: Fluid volume stage (BBL)
- Fluida - Total: Total fluid volume (BBL)
- Wellhead Pressure: Wellhead pressure (psi)
Control Panel:
- Polling Toggle: ON/OFF switch
- Polling Interval: Configurable in milliseconds (default: 100ms)
- Recording Controls: Start/Stop buttons
- Playback Controls: Play, Pause, Stop with speed selector (1x, 2x, 5x, 10x)
- Export Buttons: Excel and PDF export
- Reset State: Clear current readings
- Delete Readings: Remove recorded data
Status Bar:
- Connection status
- Data points count
- Data source indicator (Hardware/Dummy)
- Last update timestamp
- Application status (Ready/Idle)
Navigation Tabs:
- Main Display
- Gauge Chart
- Line Chart
4. Connect Device Configuration
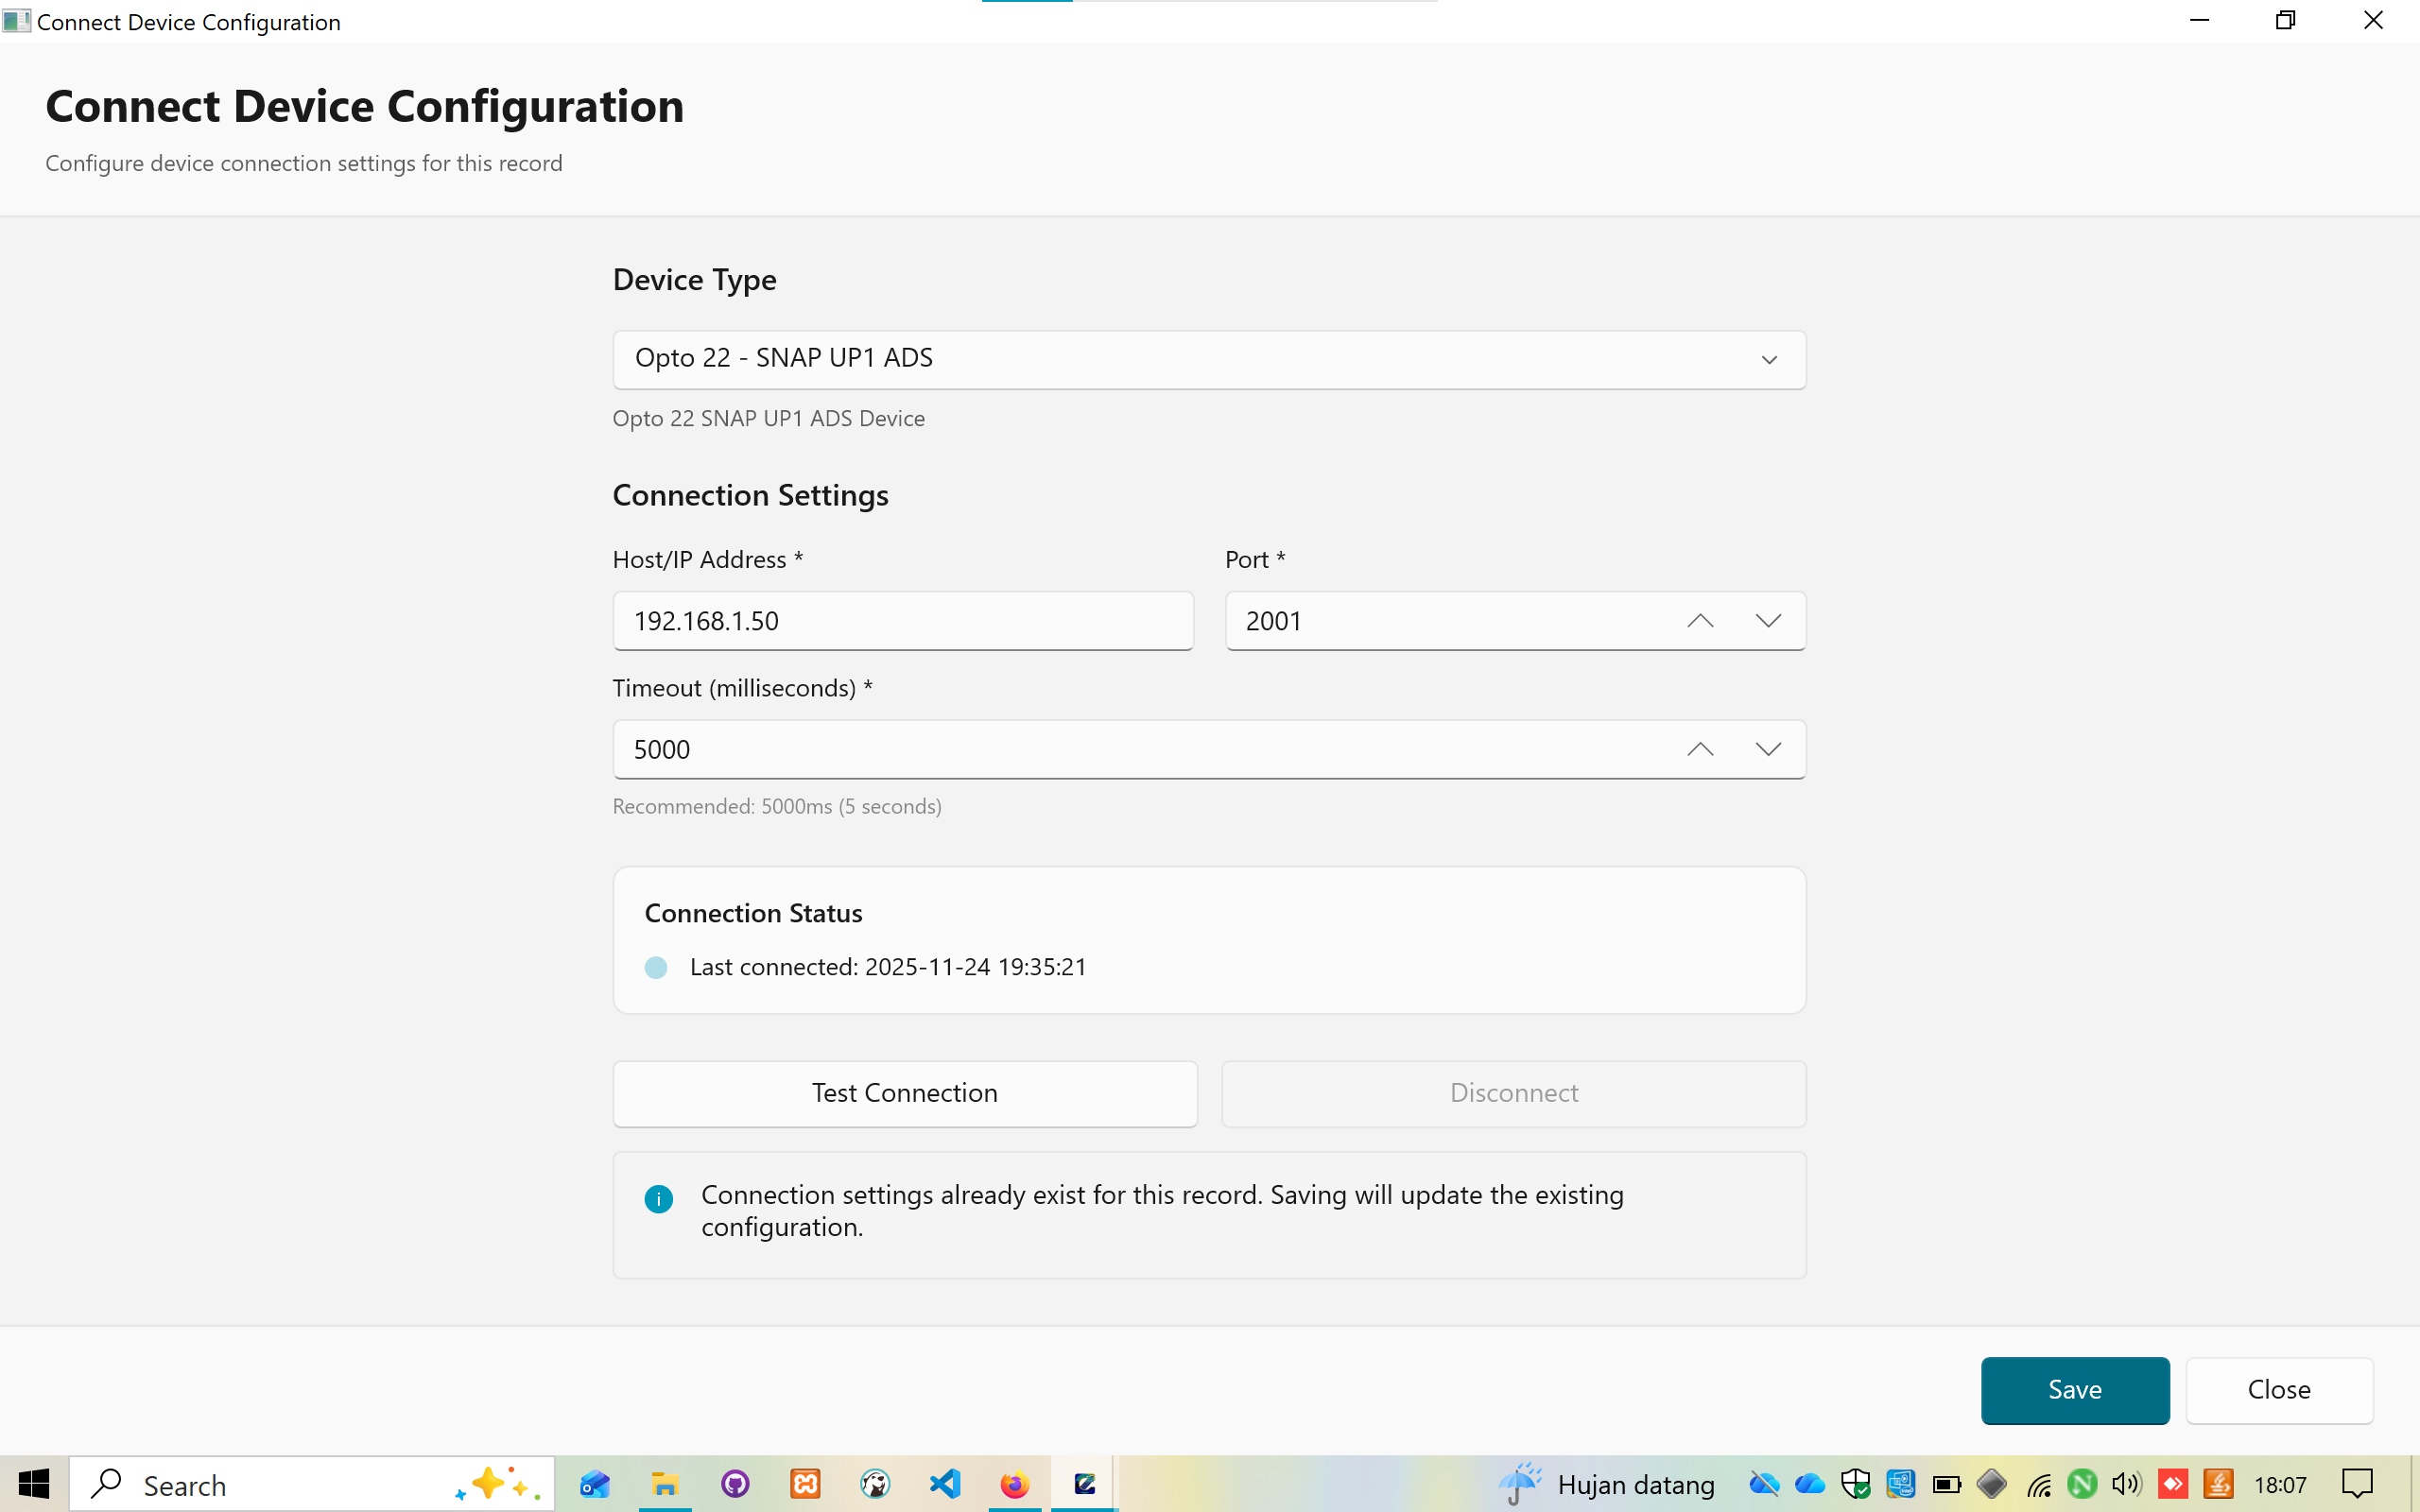
Configuration Options:
- Device Type: Dropdown selection (Opto 22 - SNAP UP1 ADS)
- Host/IP Address: Input field for device IP (e.g., 192.168.1.50)
- Port: Configurable port number (default: 2001)
- Timeout: Timeout in milliseconds (default: 5000ms)
- Recommended: 5000ms (5 seconds)
Features:
- Connection Status display with timestamp
- Test Connection button
- Disconnect option
- Save/Close buttons
- Information message for existing configurations
5. General Data Configuration
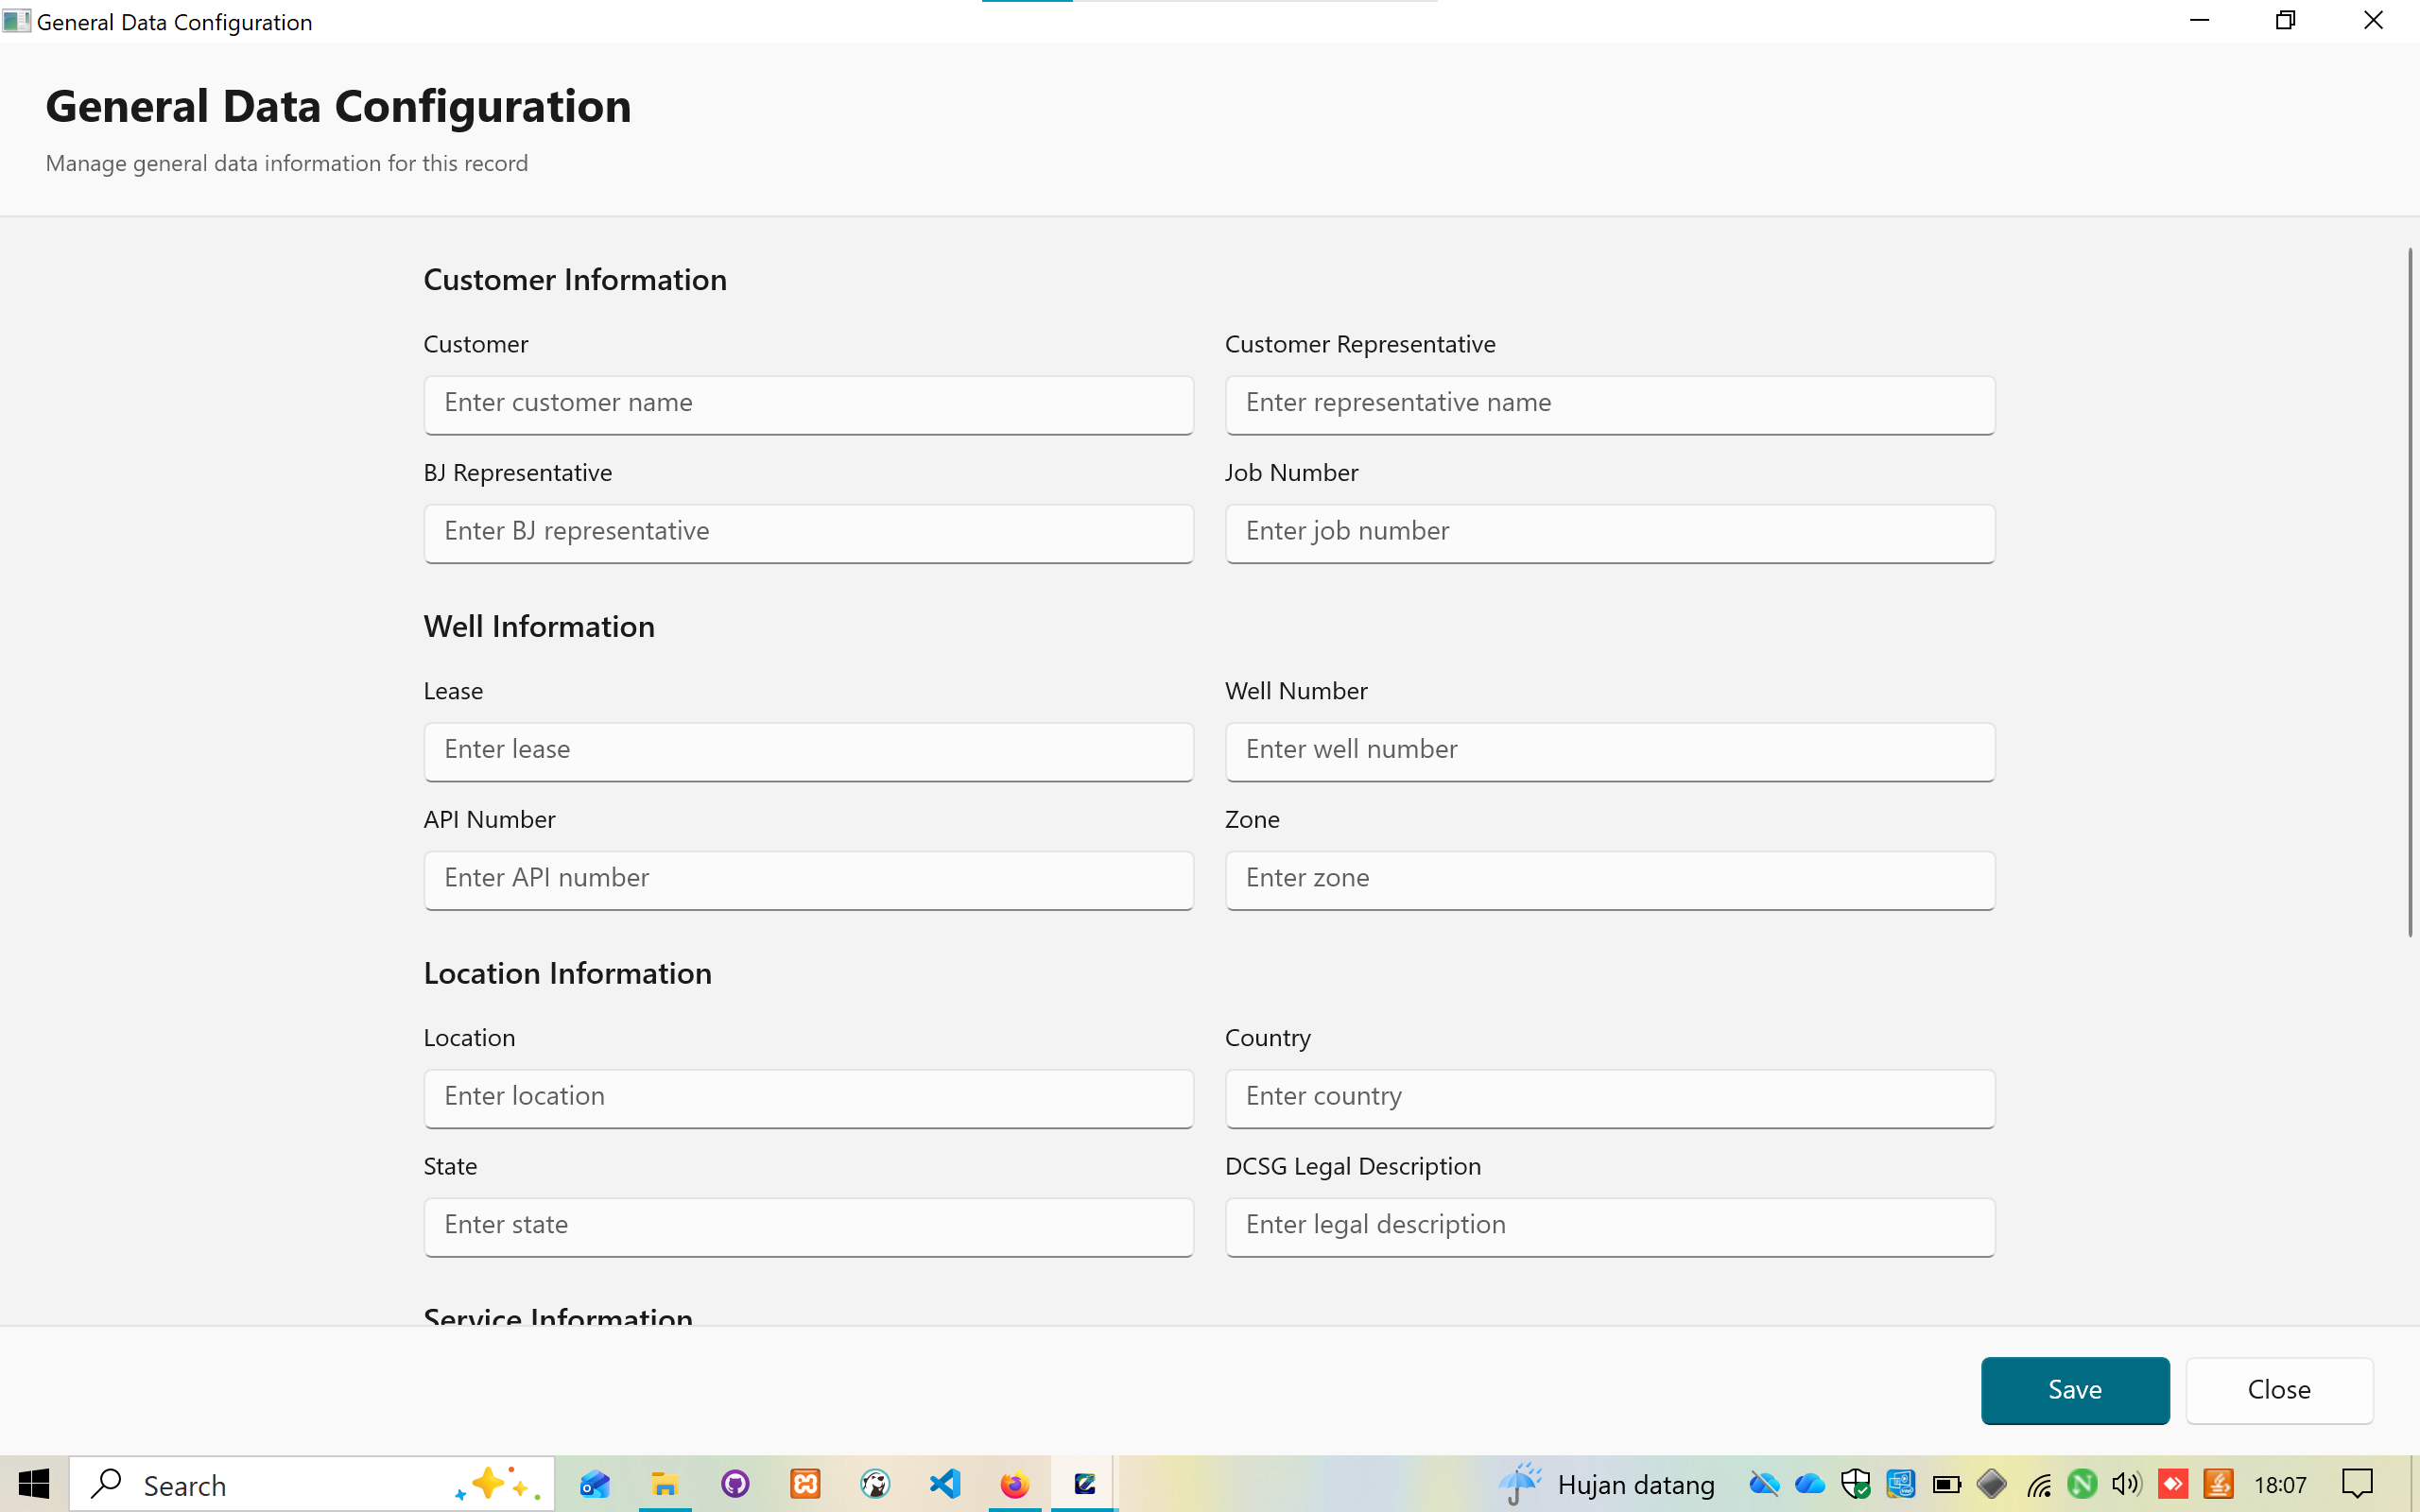
Comprehensive data entry form organized in sections:
Customer Information:
- Customer name
- Customer representative
- BJ representative
- Job number
Well Information:
- Lease name
- Well number
- API number
- Zone/formation
Location Information:
- Location (field)
- Country
- State/province
- DCSG Legal Description
Service Information:
- Service start date
- Service end date
- Service type
- Equipment details
All fields are text inputs with clear labels and placeholders.
6. I/O Device Configuration
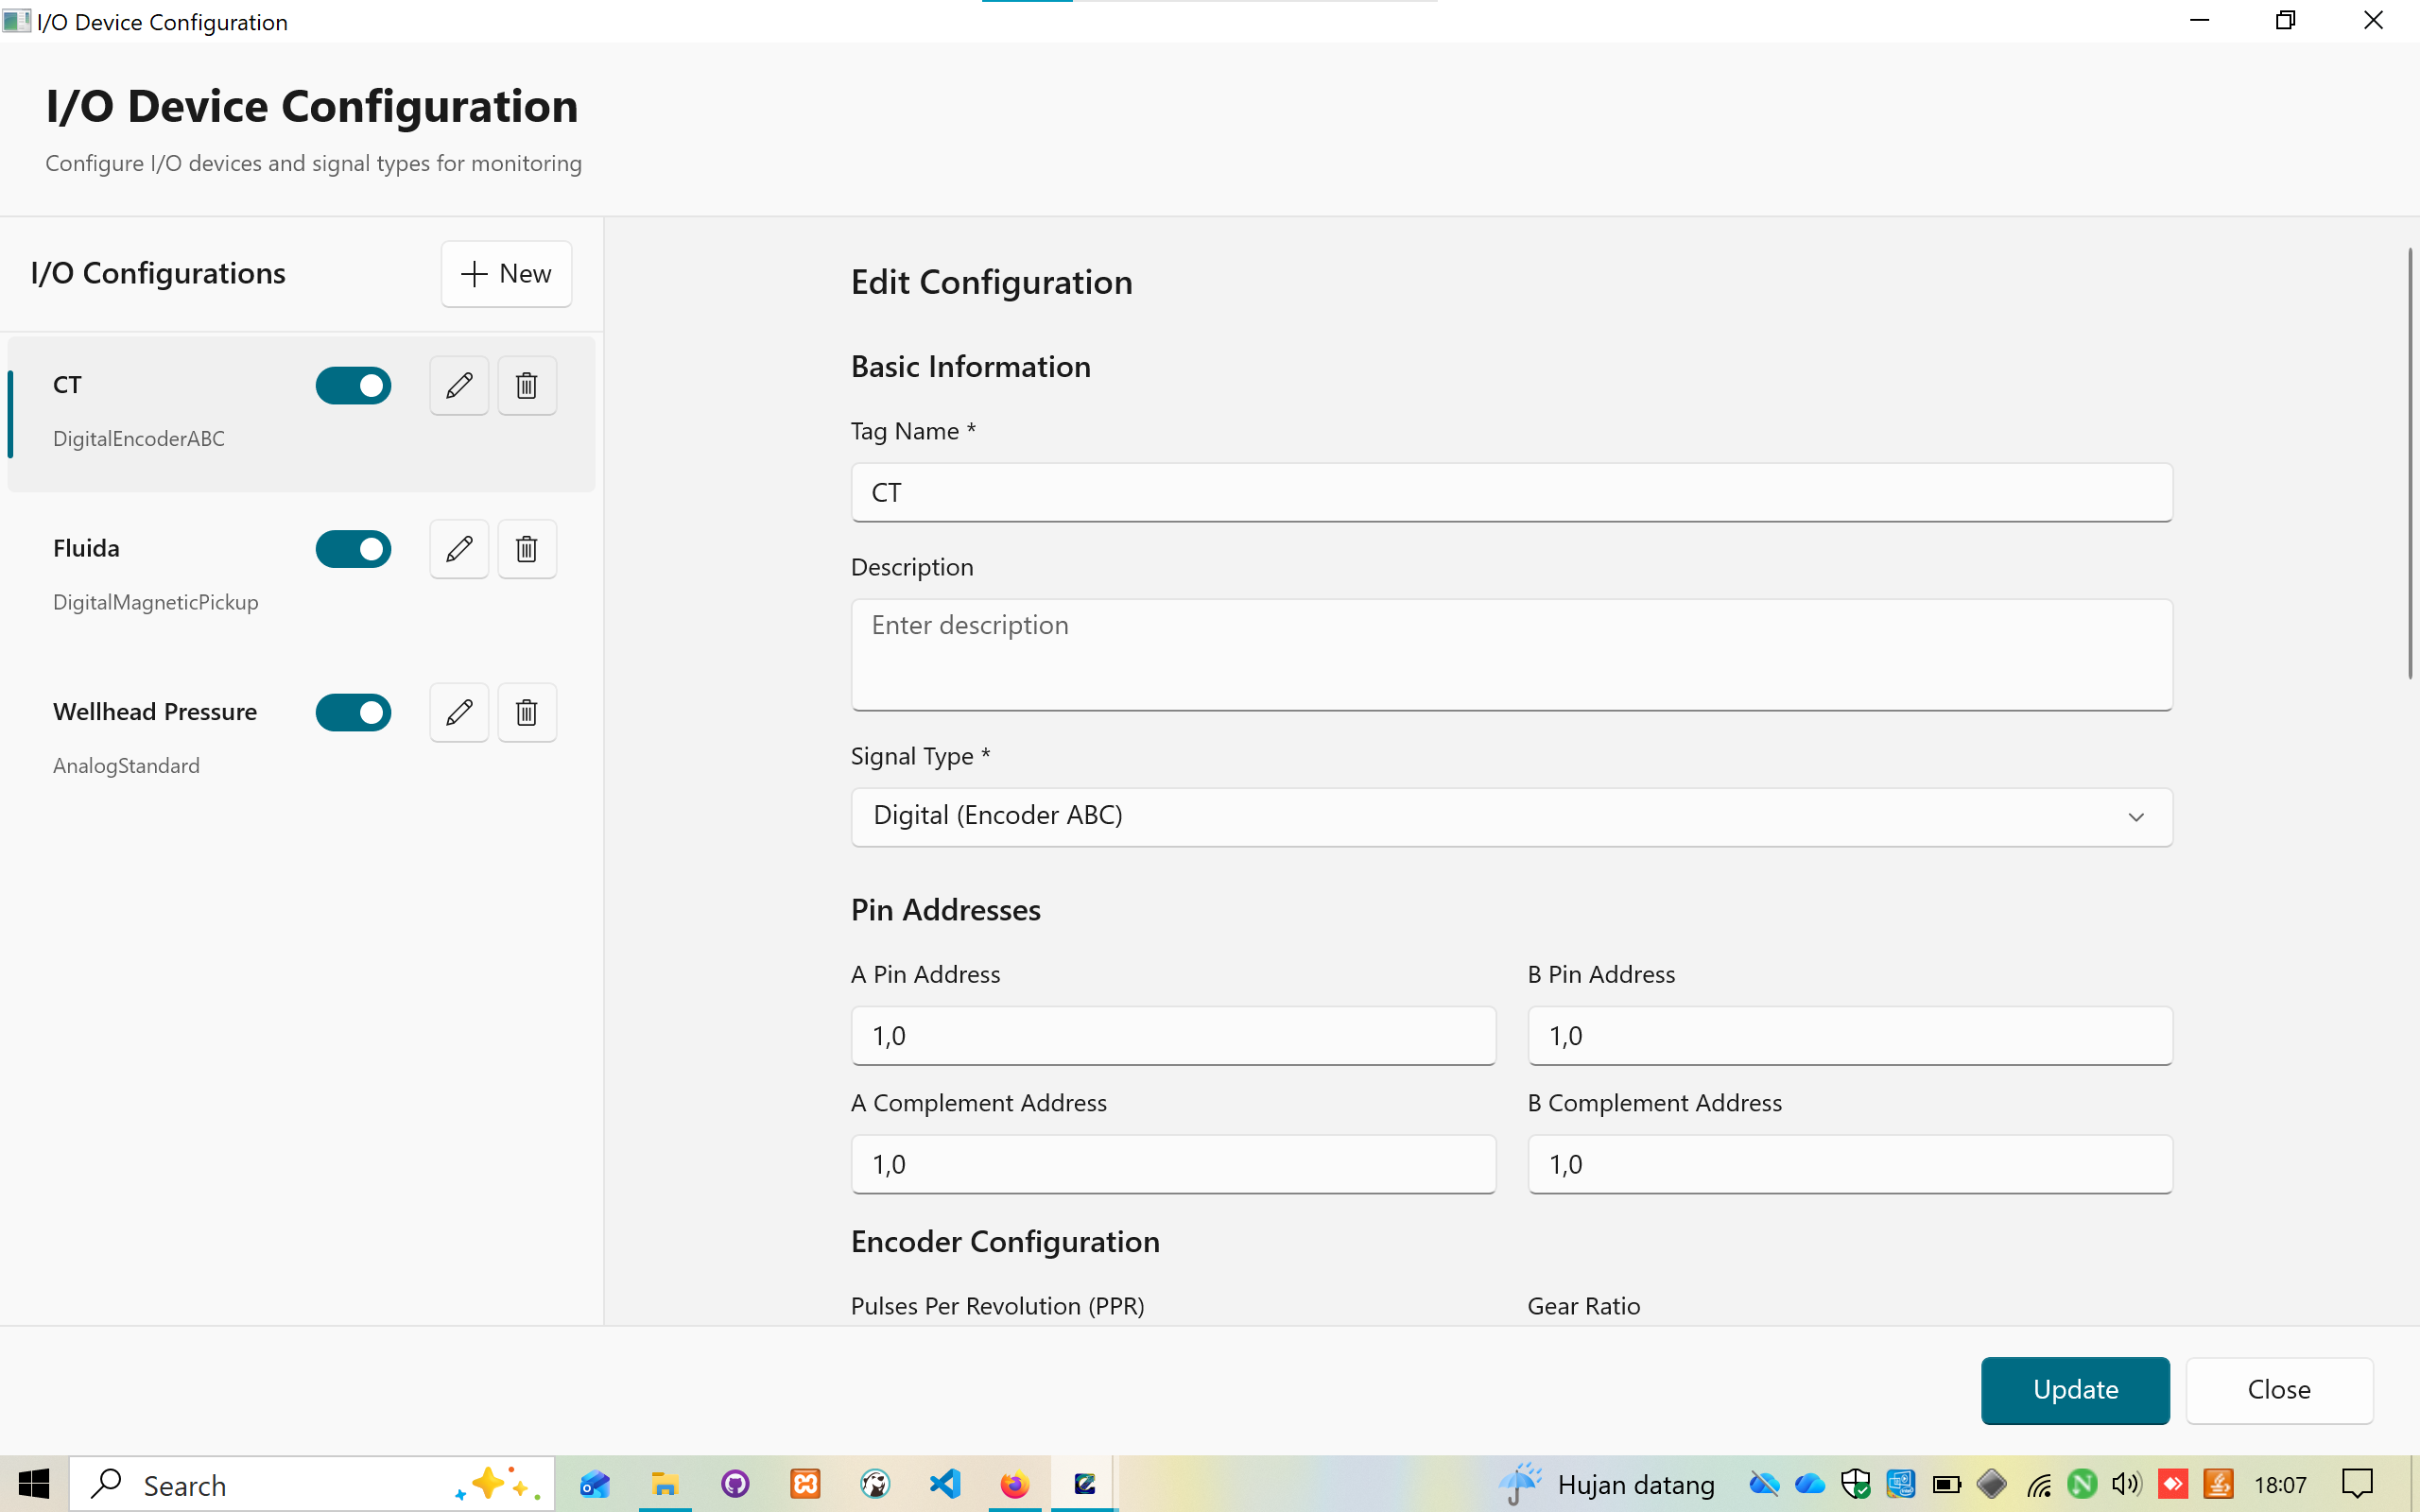
List-based configuration interface for each sensor:
Configuration List (Left Panel):
- CT - DigitalEncoderABC
- Fluida - DigitalMagneticPickup
- Wellhead Pressure - AnalogStandard
Each item has:
- Enable/disable toggle switch
- Edit button (pencil icon)
- Delete button (trash icon)
- Add New button to create additional sensors
Edit Configuration Panel (Right Side):
Basic Information:
- Tag Name (required field)
- Description (optional)
Signal Type Selection:
- Digital (Encoder ABC)
- Analog Standard
- Digital Magnetic Pickup
Pin Addresses:
- A Pin Address
- B Pin Address
- A Complement Address
- B Complement Address
Encoder Configuration:
- Pulses Per Revolution (PPR)
- Gear Ratio
Actions:
- Update button to save changes
- Close button to exit
7. Chart Setup Configuration - Gauge
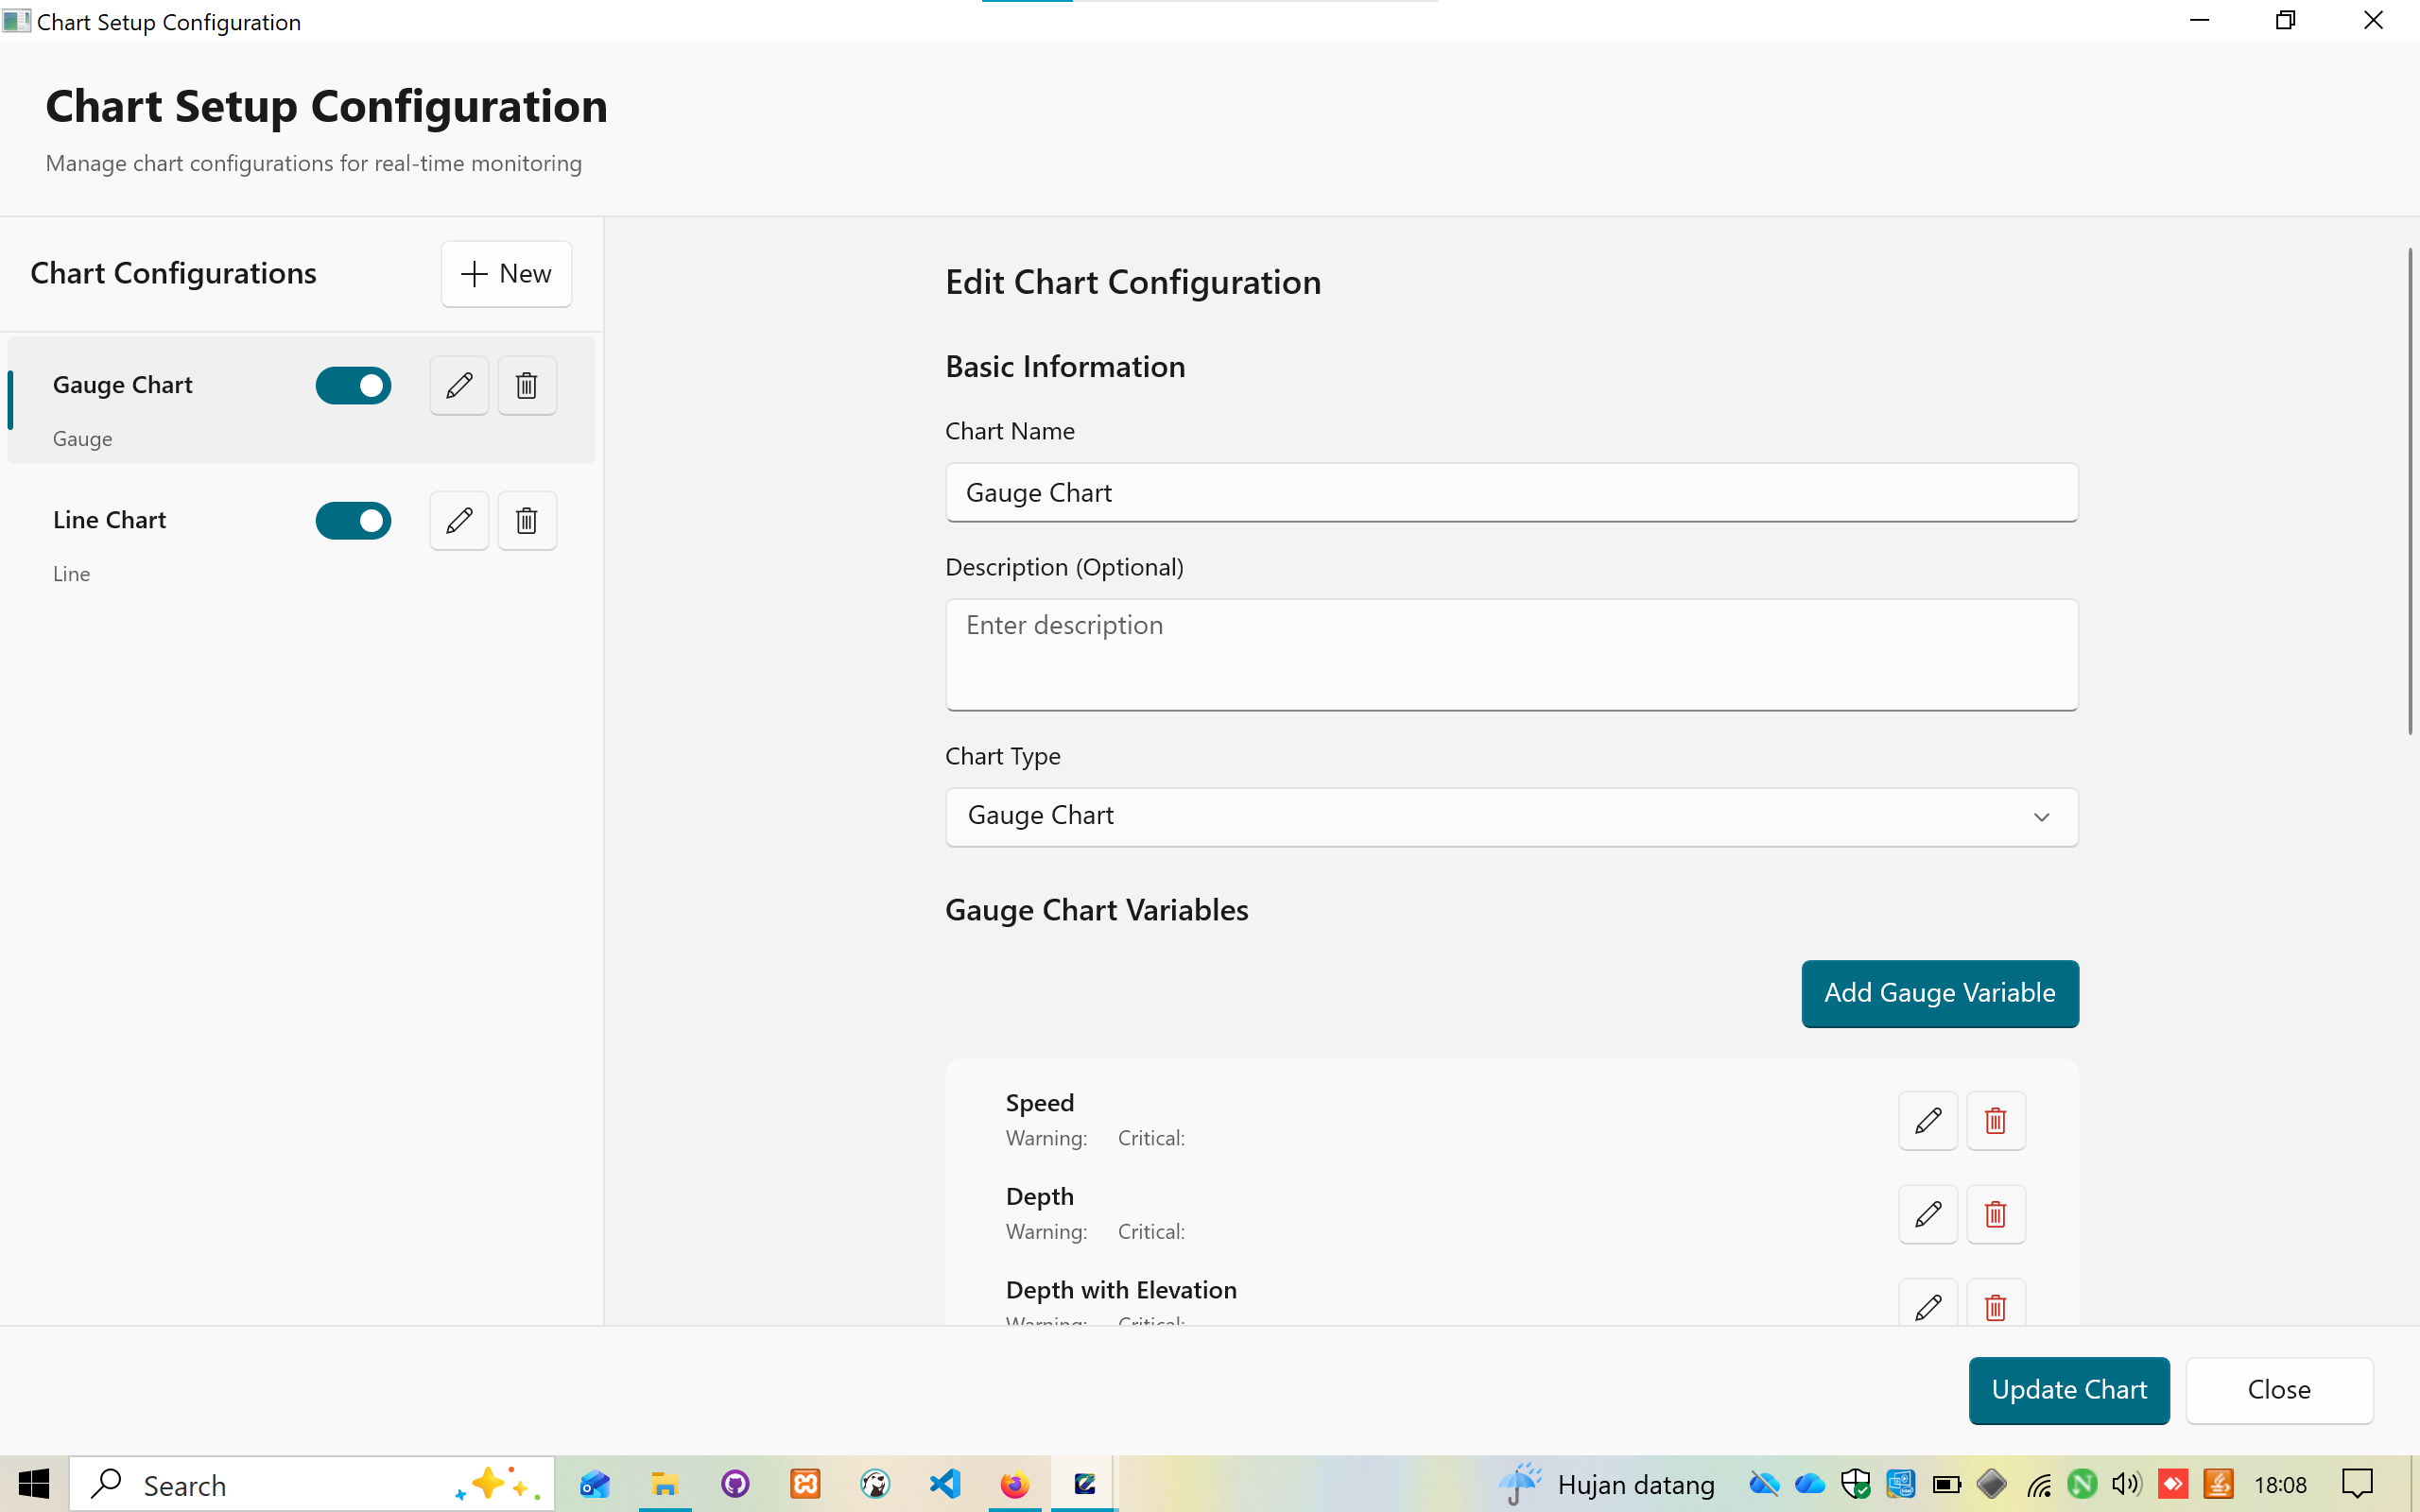
Left Panel - Chart Configurations:
- Gauge Chart (active)
- Line Chart
- Add New button
Right Panel - Edit Chart Configuration:
Basic Information:
- Chart Name
- Description (Optional)
- Chart Type dropdown (Gauge Chart / Line Chart)
Gauge Chart Variables:
- Add Gauge Variable button
- List of configured variables:
- Speed (Warning, Critical thresholds)
- Depth (Warning, Critical thresholds)
- Depth with Elevation (Warning, Critical thresholds)
- And more...
Each variable has:
- Edit button (pencil icon)
- Delete button (trash icon)
Actions:
- Update Chart button
- Close button
8. Chart Setup Configuration - Line Chart
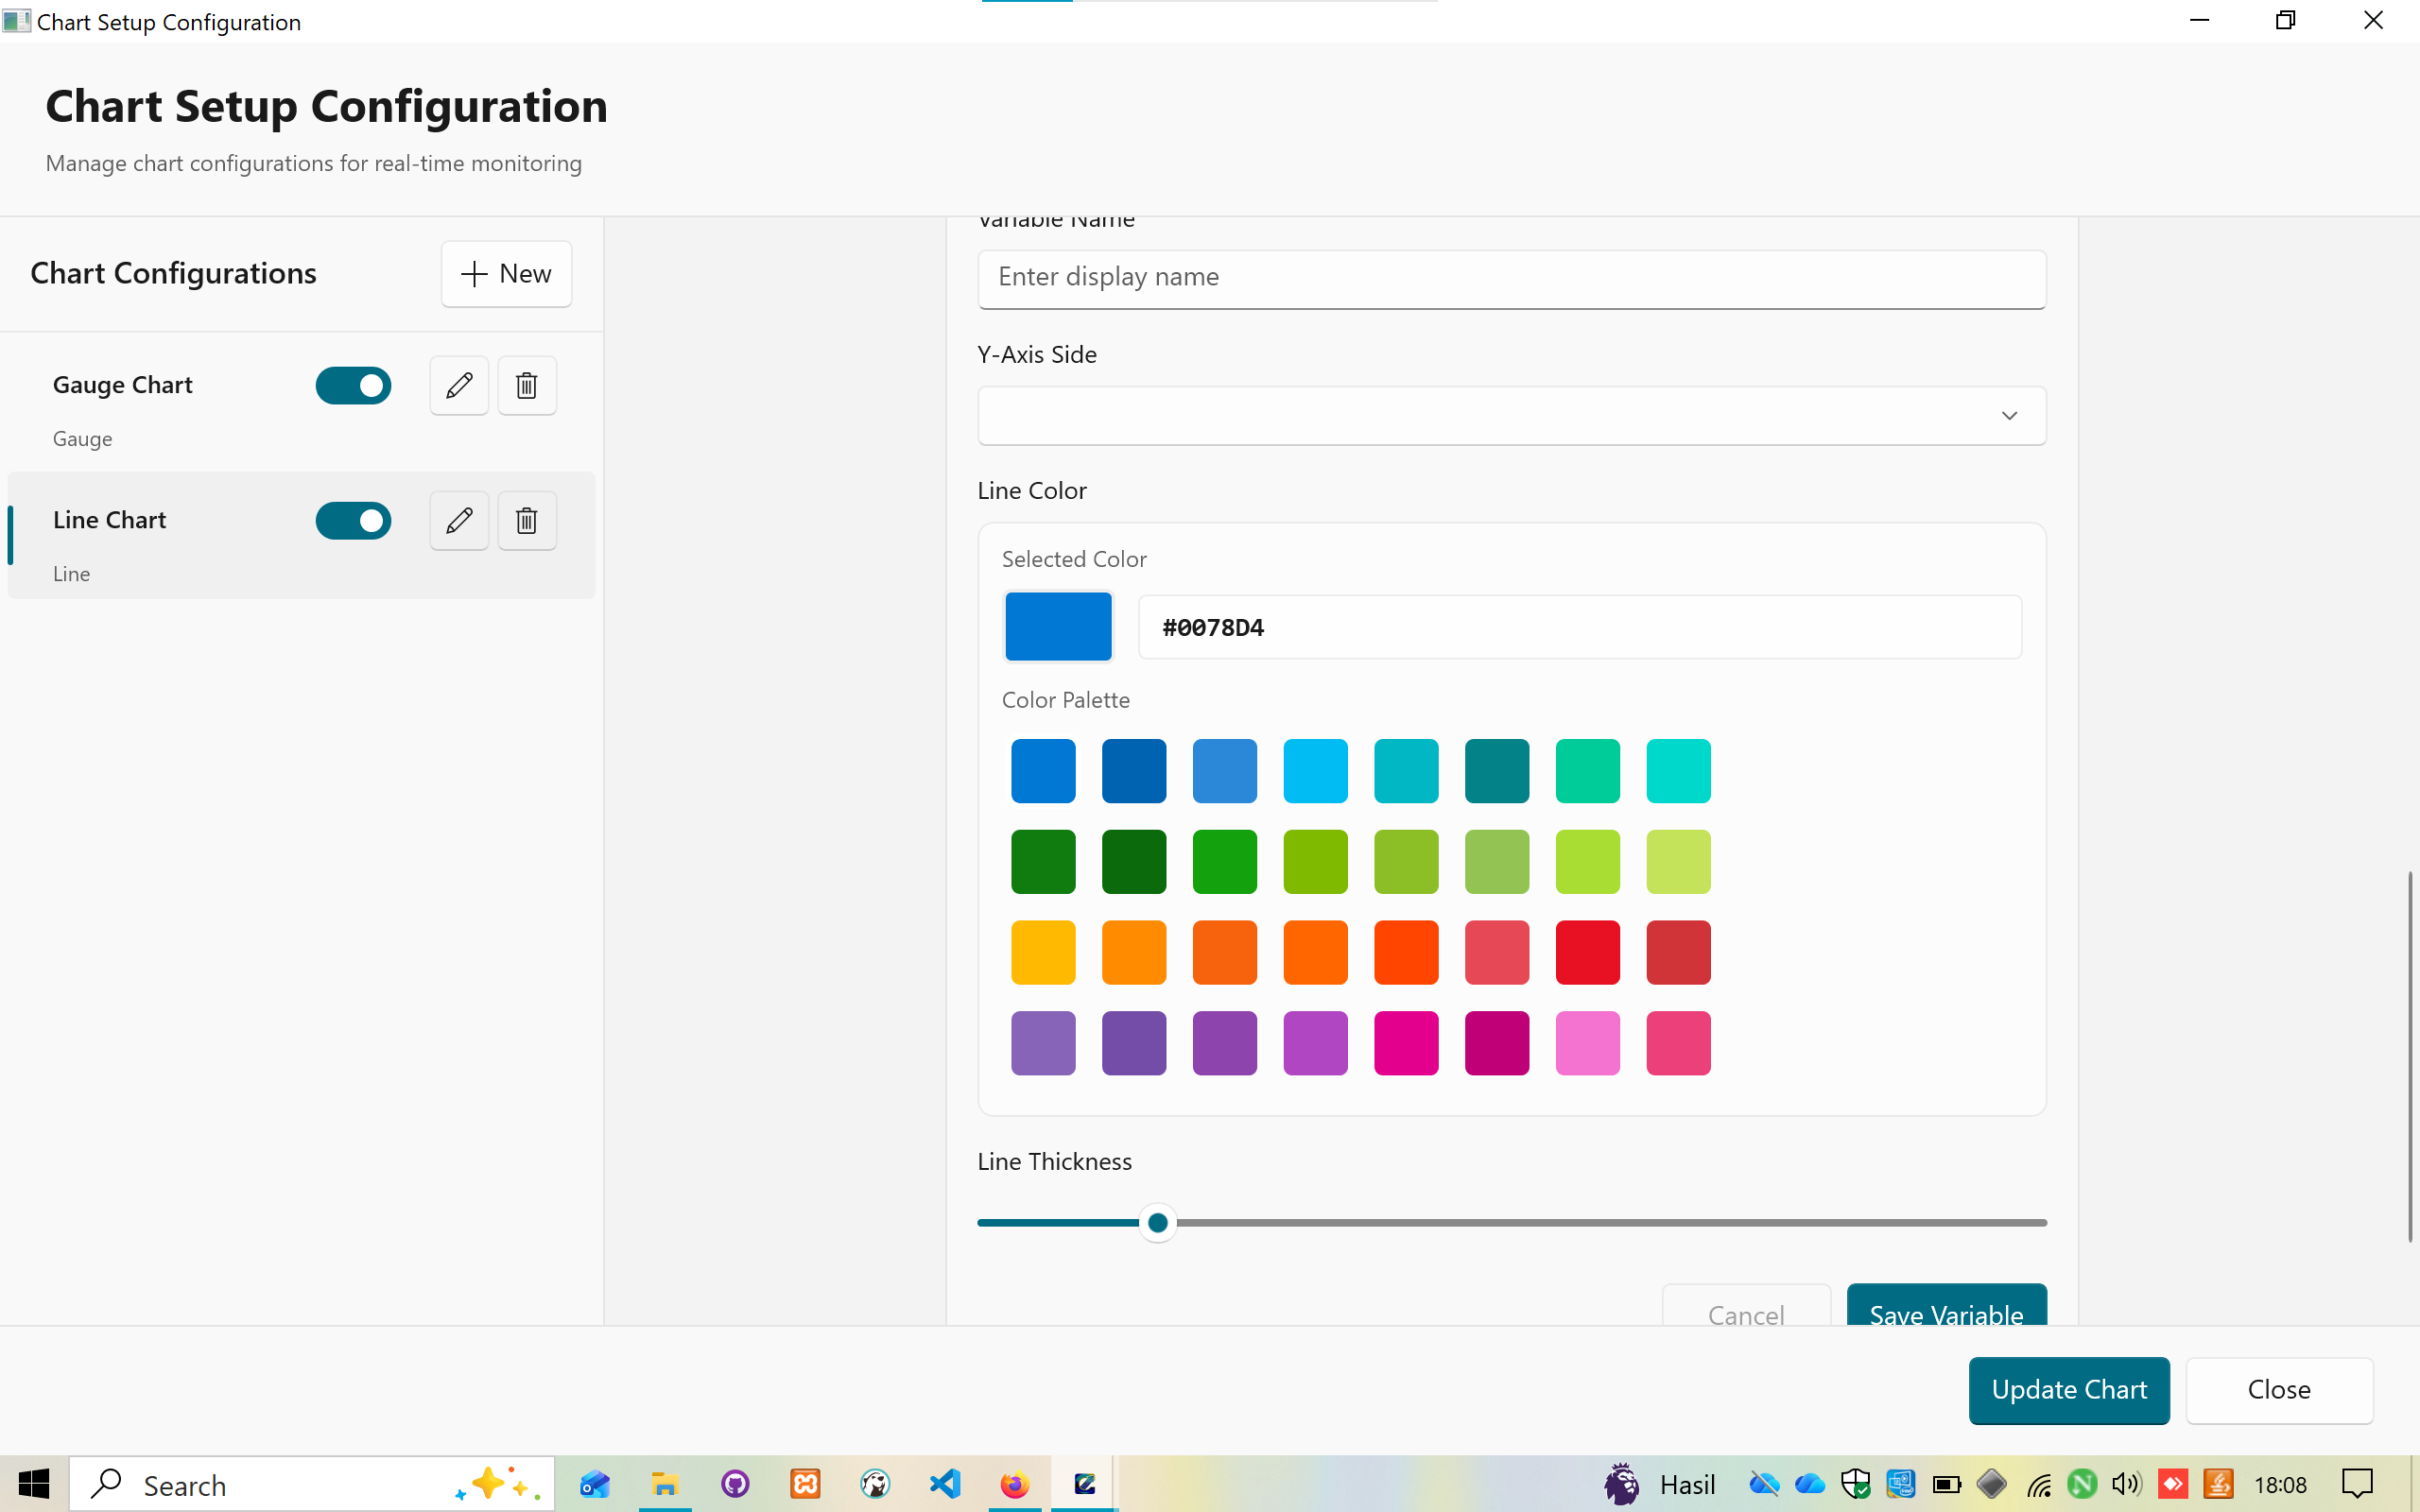
Line Chart Variable Configuration:
Variable Settings:
- Variable Name field
- Display name input
- Y-Axis Side selection (Left/Right)
Line Color Picker:
- Selected Color display with hex code (#0078D4)
- Color Palette grid with 40+ colors:
- Blues (various shades)
- Greens (various shades)
- Yellows and oranges
- Reds and pinks
- Purples and magentas
Line Thickness:
- Slider control for adjusting line width
- Visual preview of thickness
Actions:
- Save Variable button
- Cancel button
- Update Chart button
- Close button
9. Export to Excel Dialog
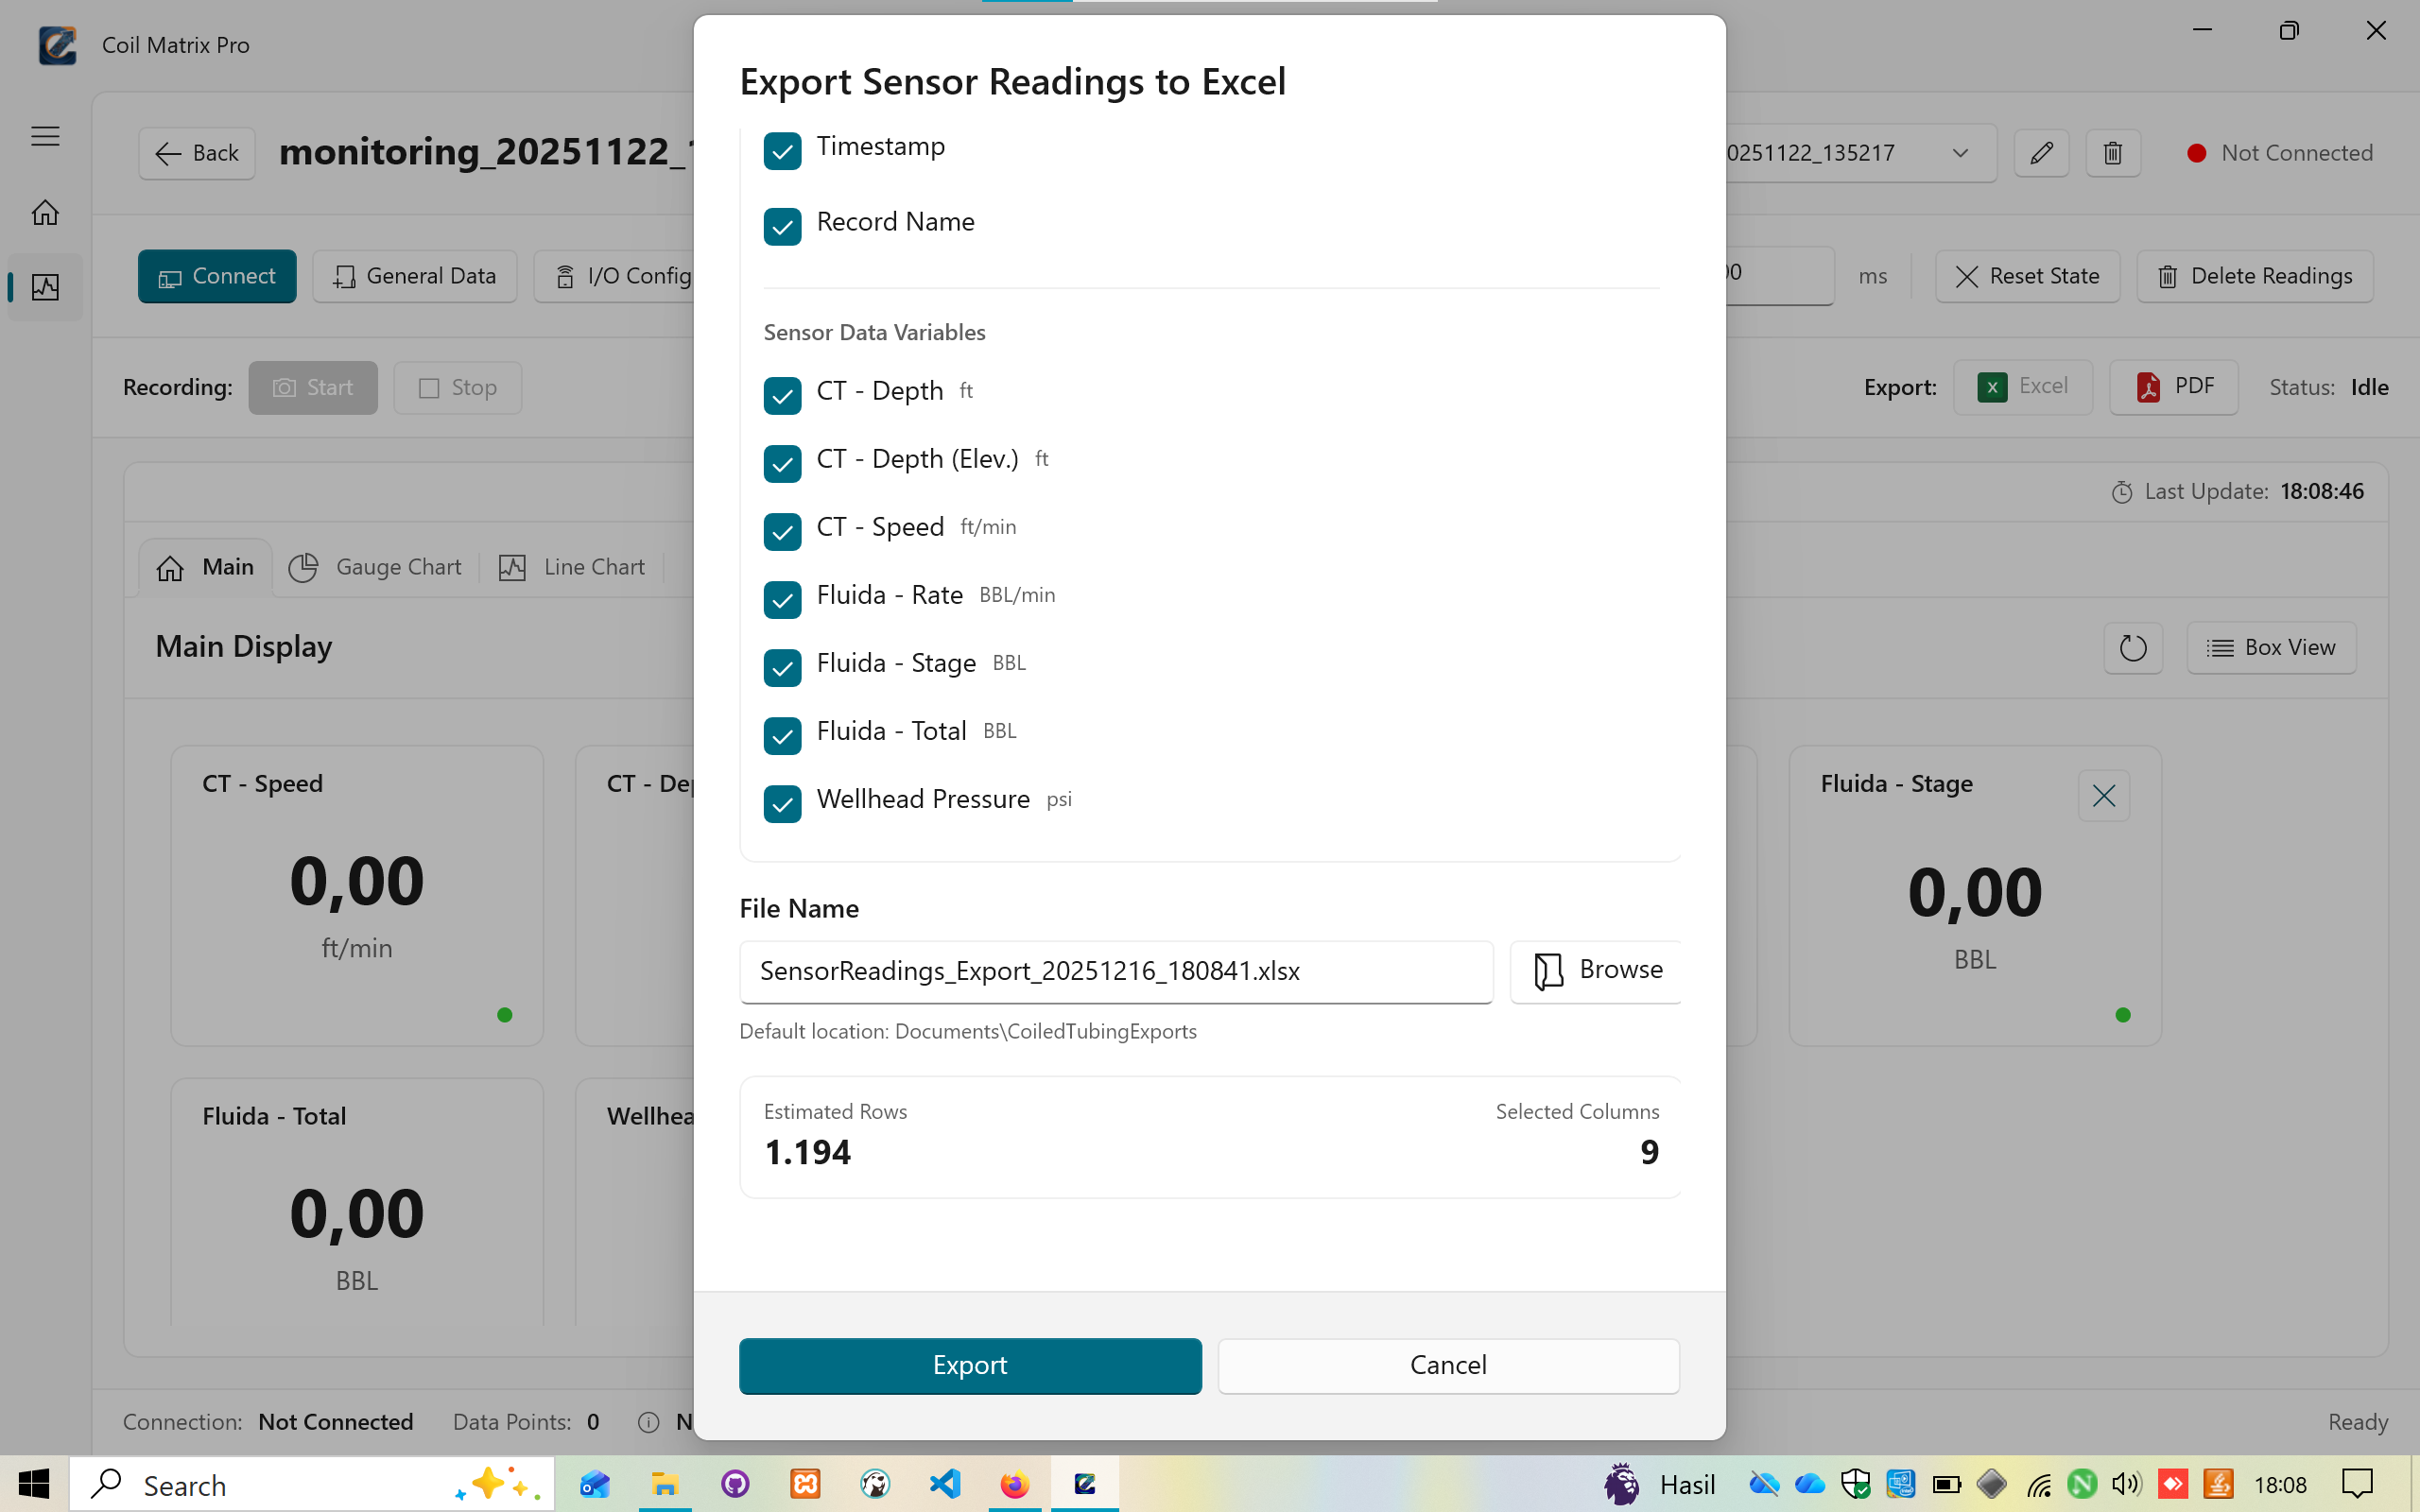
Export Sensor Readings to Excel
Column Selection:
- Timestamp (checkbox)
- Record Name (checkbox)
Sensor Data Variables:
- CT - Depth (ft)
- CT - Depth (Elev.) (ft)
- CT - Speed (ft/min)
- Fluida - Rate (BBL/min)
- Fluida - Stage (BBL)
- Fluida - Total (BBL)
- Wellhead Pressure (psi)
All variables are selectable via checkboxes.
File Name:
- Auto-generated filename:
SensorReadings_Export_20251216_180841.xlsx - Browse button for custom location
- Default location: Documents\CoiledTubingExports
Export Information:
- Estimated Rows: 1,194
- Selected Columns: 9
Actions:
- Export button (primary action)
- Cancel button
10. Export to PDF Dialog
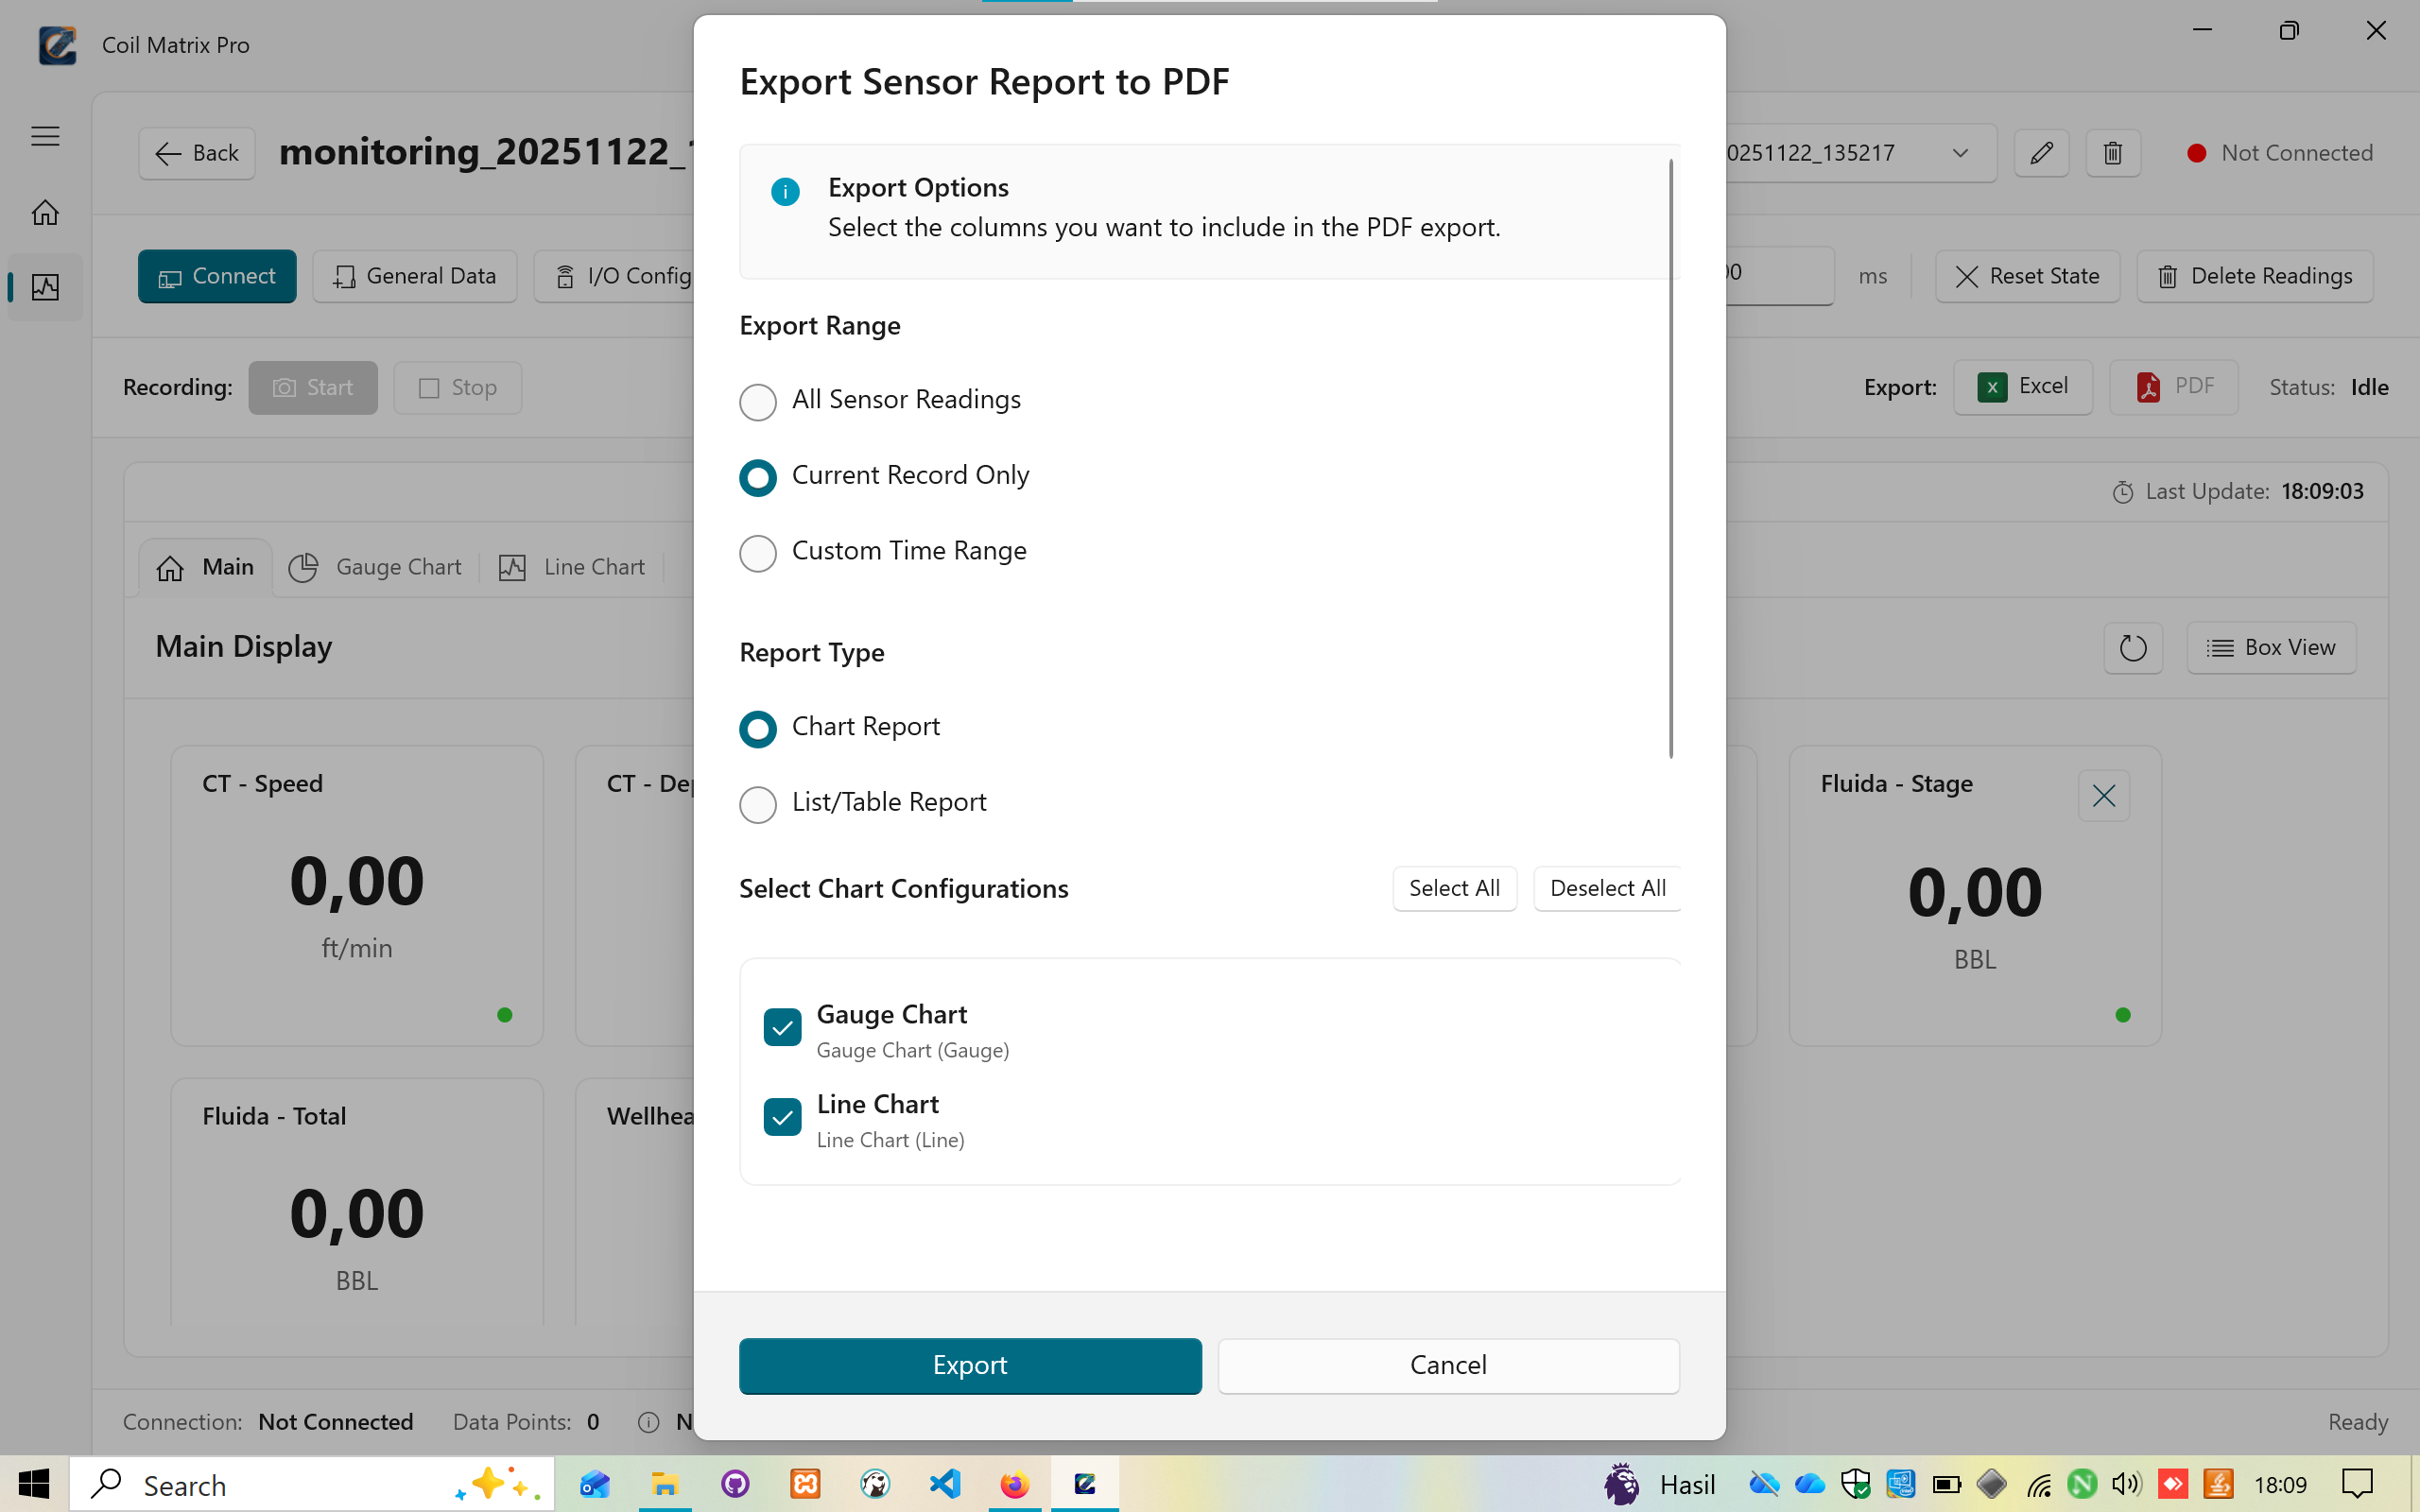
Export Sensor Report to PDF
Export Range:
- All Sensor Readings (radio button)
- Current Record Only (radio button - selected)
- Custom Time Range (radio button)
Report Type:
- Chart Report (radio button - selected)
- List/Table Report (radio button)
Select Chart Configurations:
- Select All / Deselect All buttons
- Gauge Chart (checkbox - checked)
- Description: Gauge Chart (Gauge)
- Line Chart (checkbox - checked)
- Description: Line Chart (Line)
Actions:
- Export button (primary action)
- Cancel button
11. Gauge Chart View
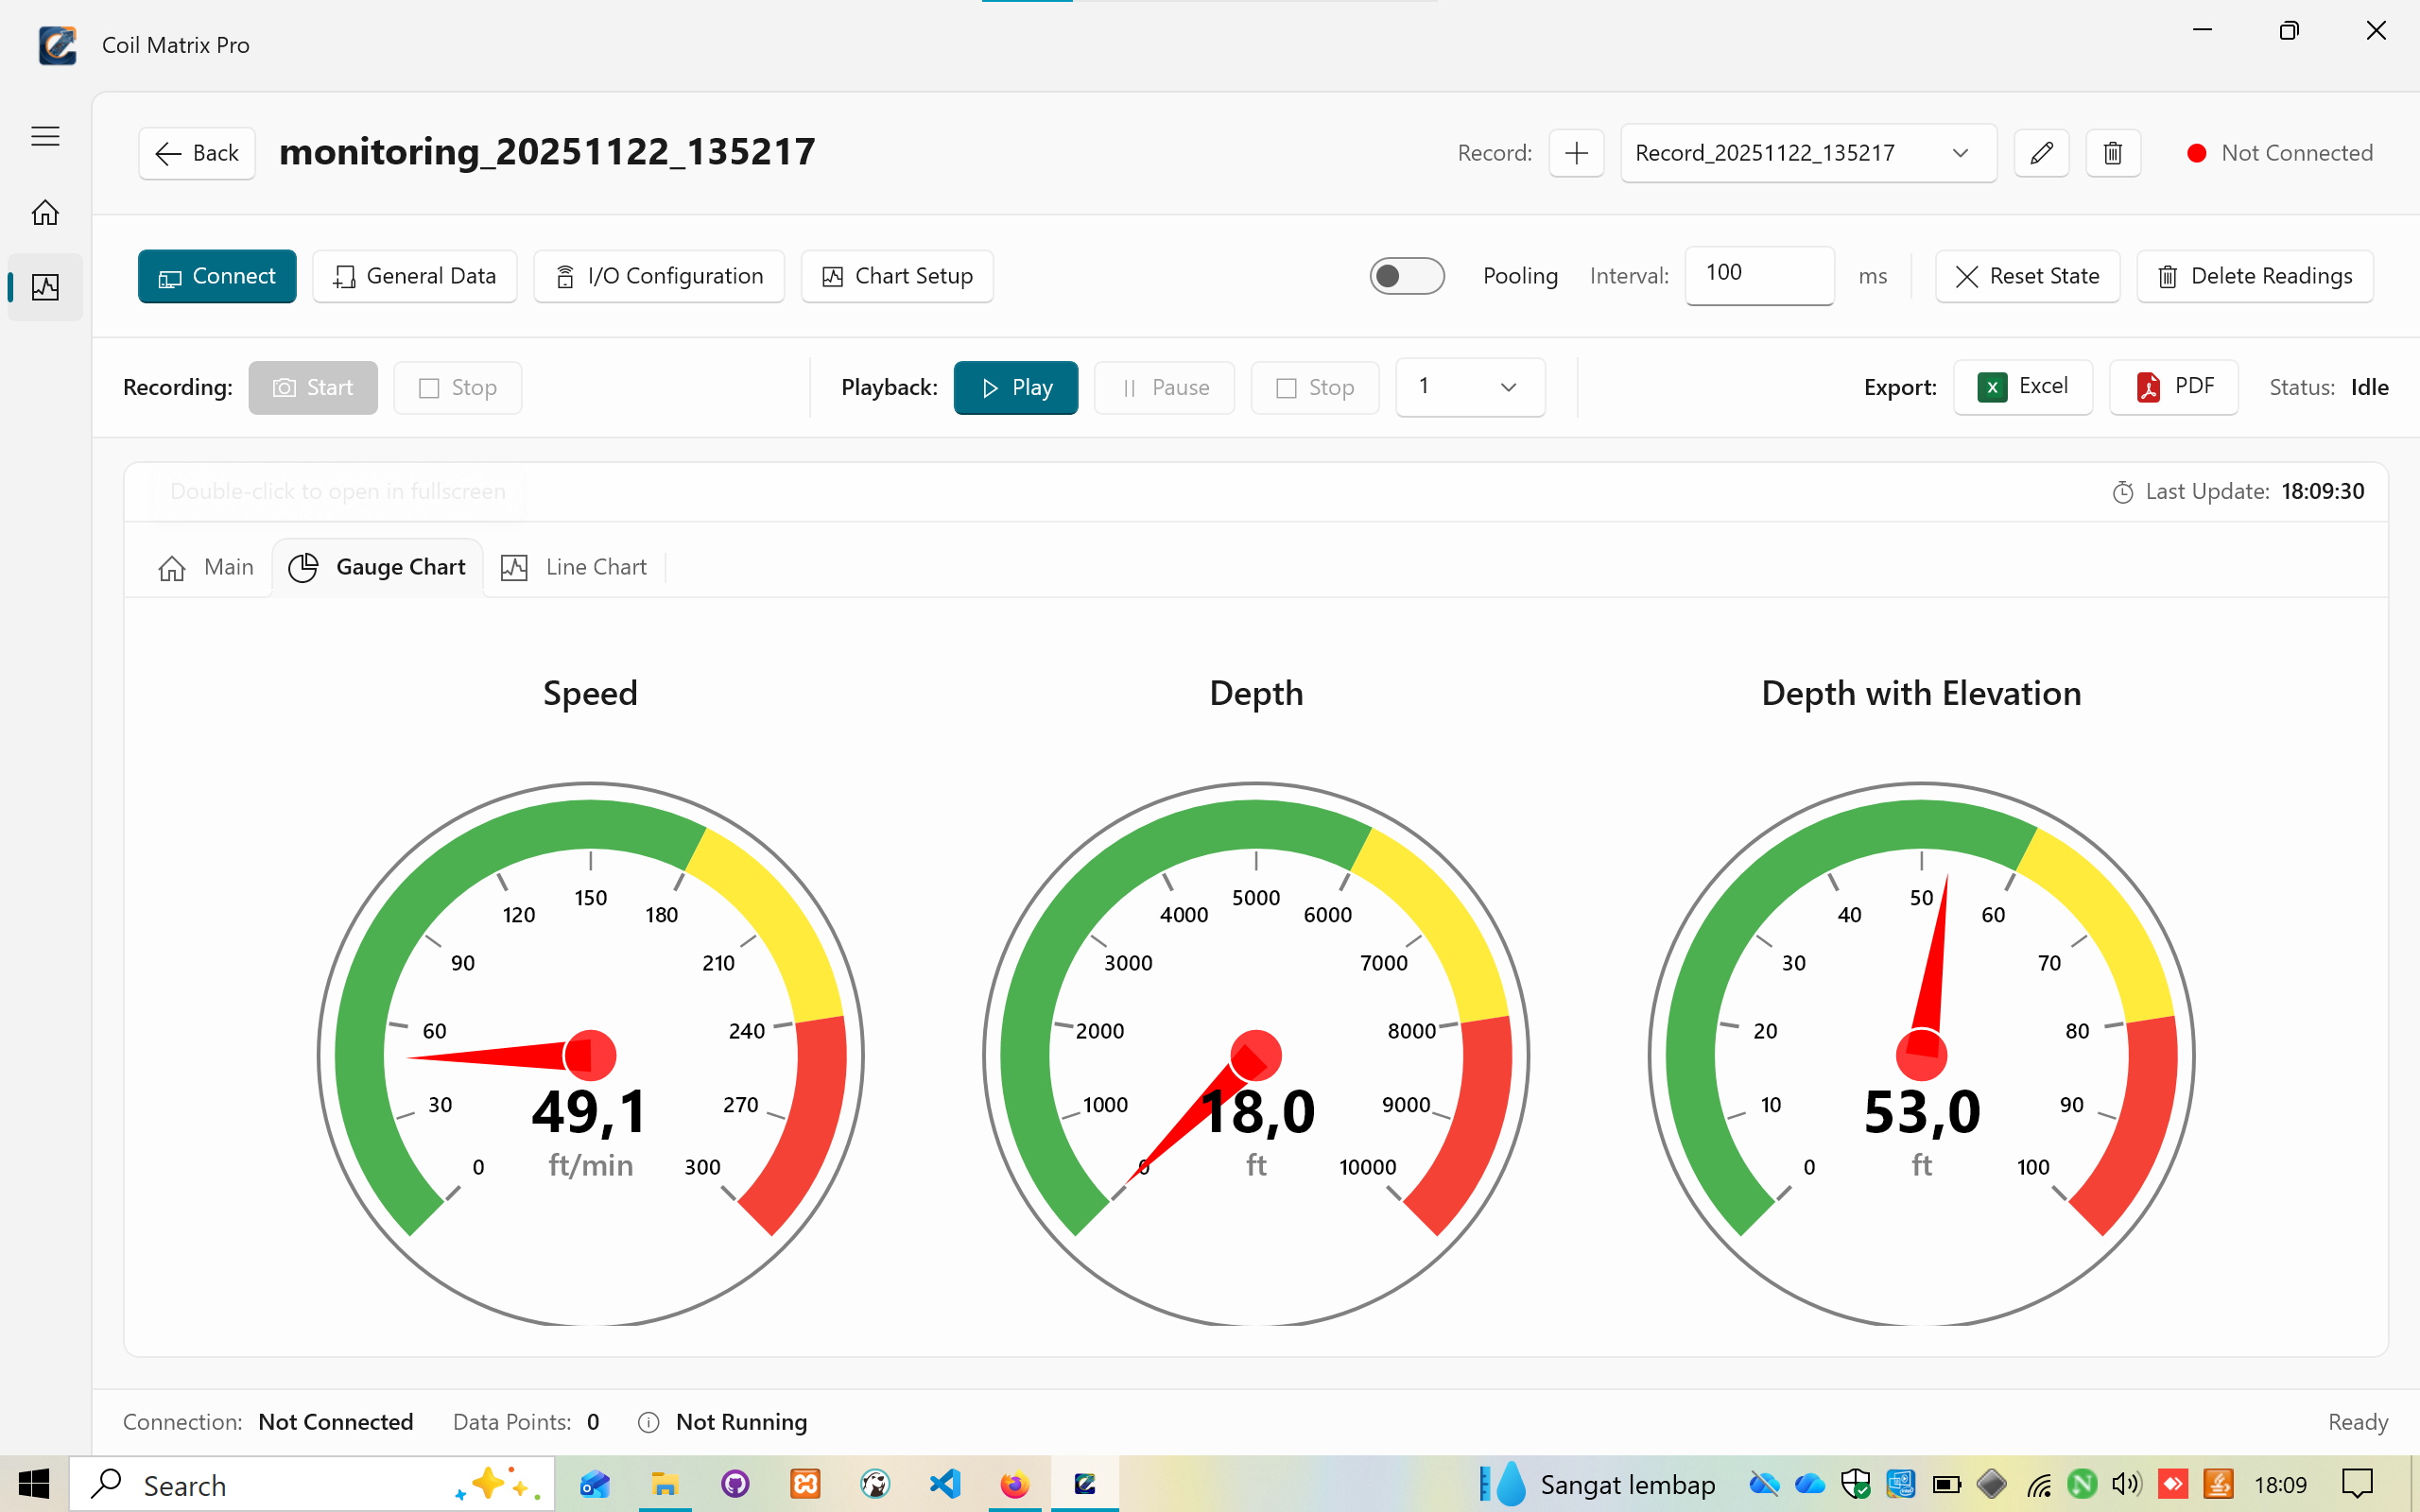
Display Features:
- Three circular gauge charts in top row:
- Speed: 49.1 ft/min
- Depth: 18.0 ft
- Depth with Elevation: 53.0 ft
- Additional gauges in bottom row:
- Fluida: 180.0 (partially visible)
- Stage: 33.6 (partially visible)
Gauge Characteristics:
- Color-coded zones:
- Green: Safe operating range
- Yellow: Warning zone
- Red: Critical zone
- Large numeric display in center
- Unit labels below values
- Smooth needle animation
- Clean, professional design
Navigation:
- Double-click to open in fullscreen mode
12. Gauge Chart - Fullscreen
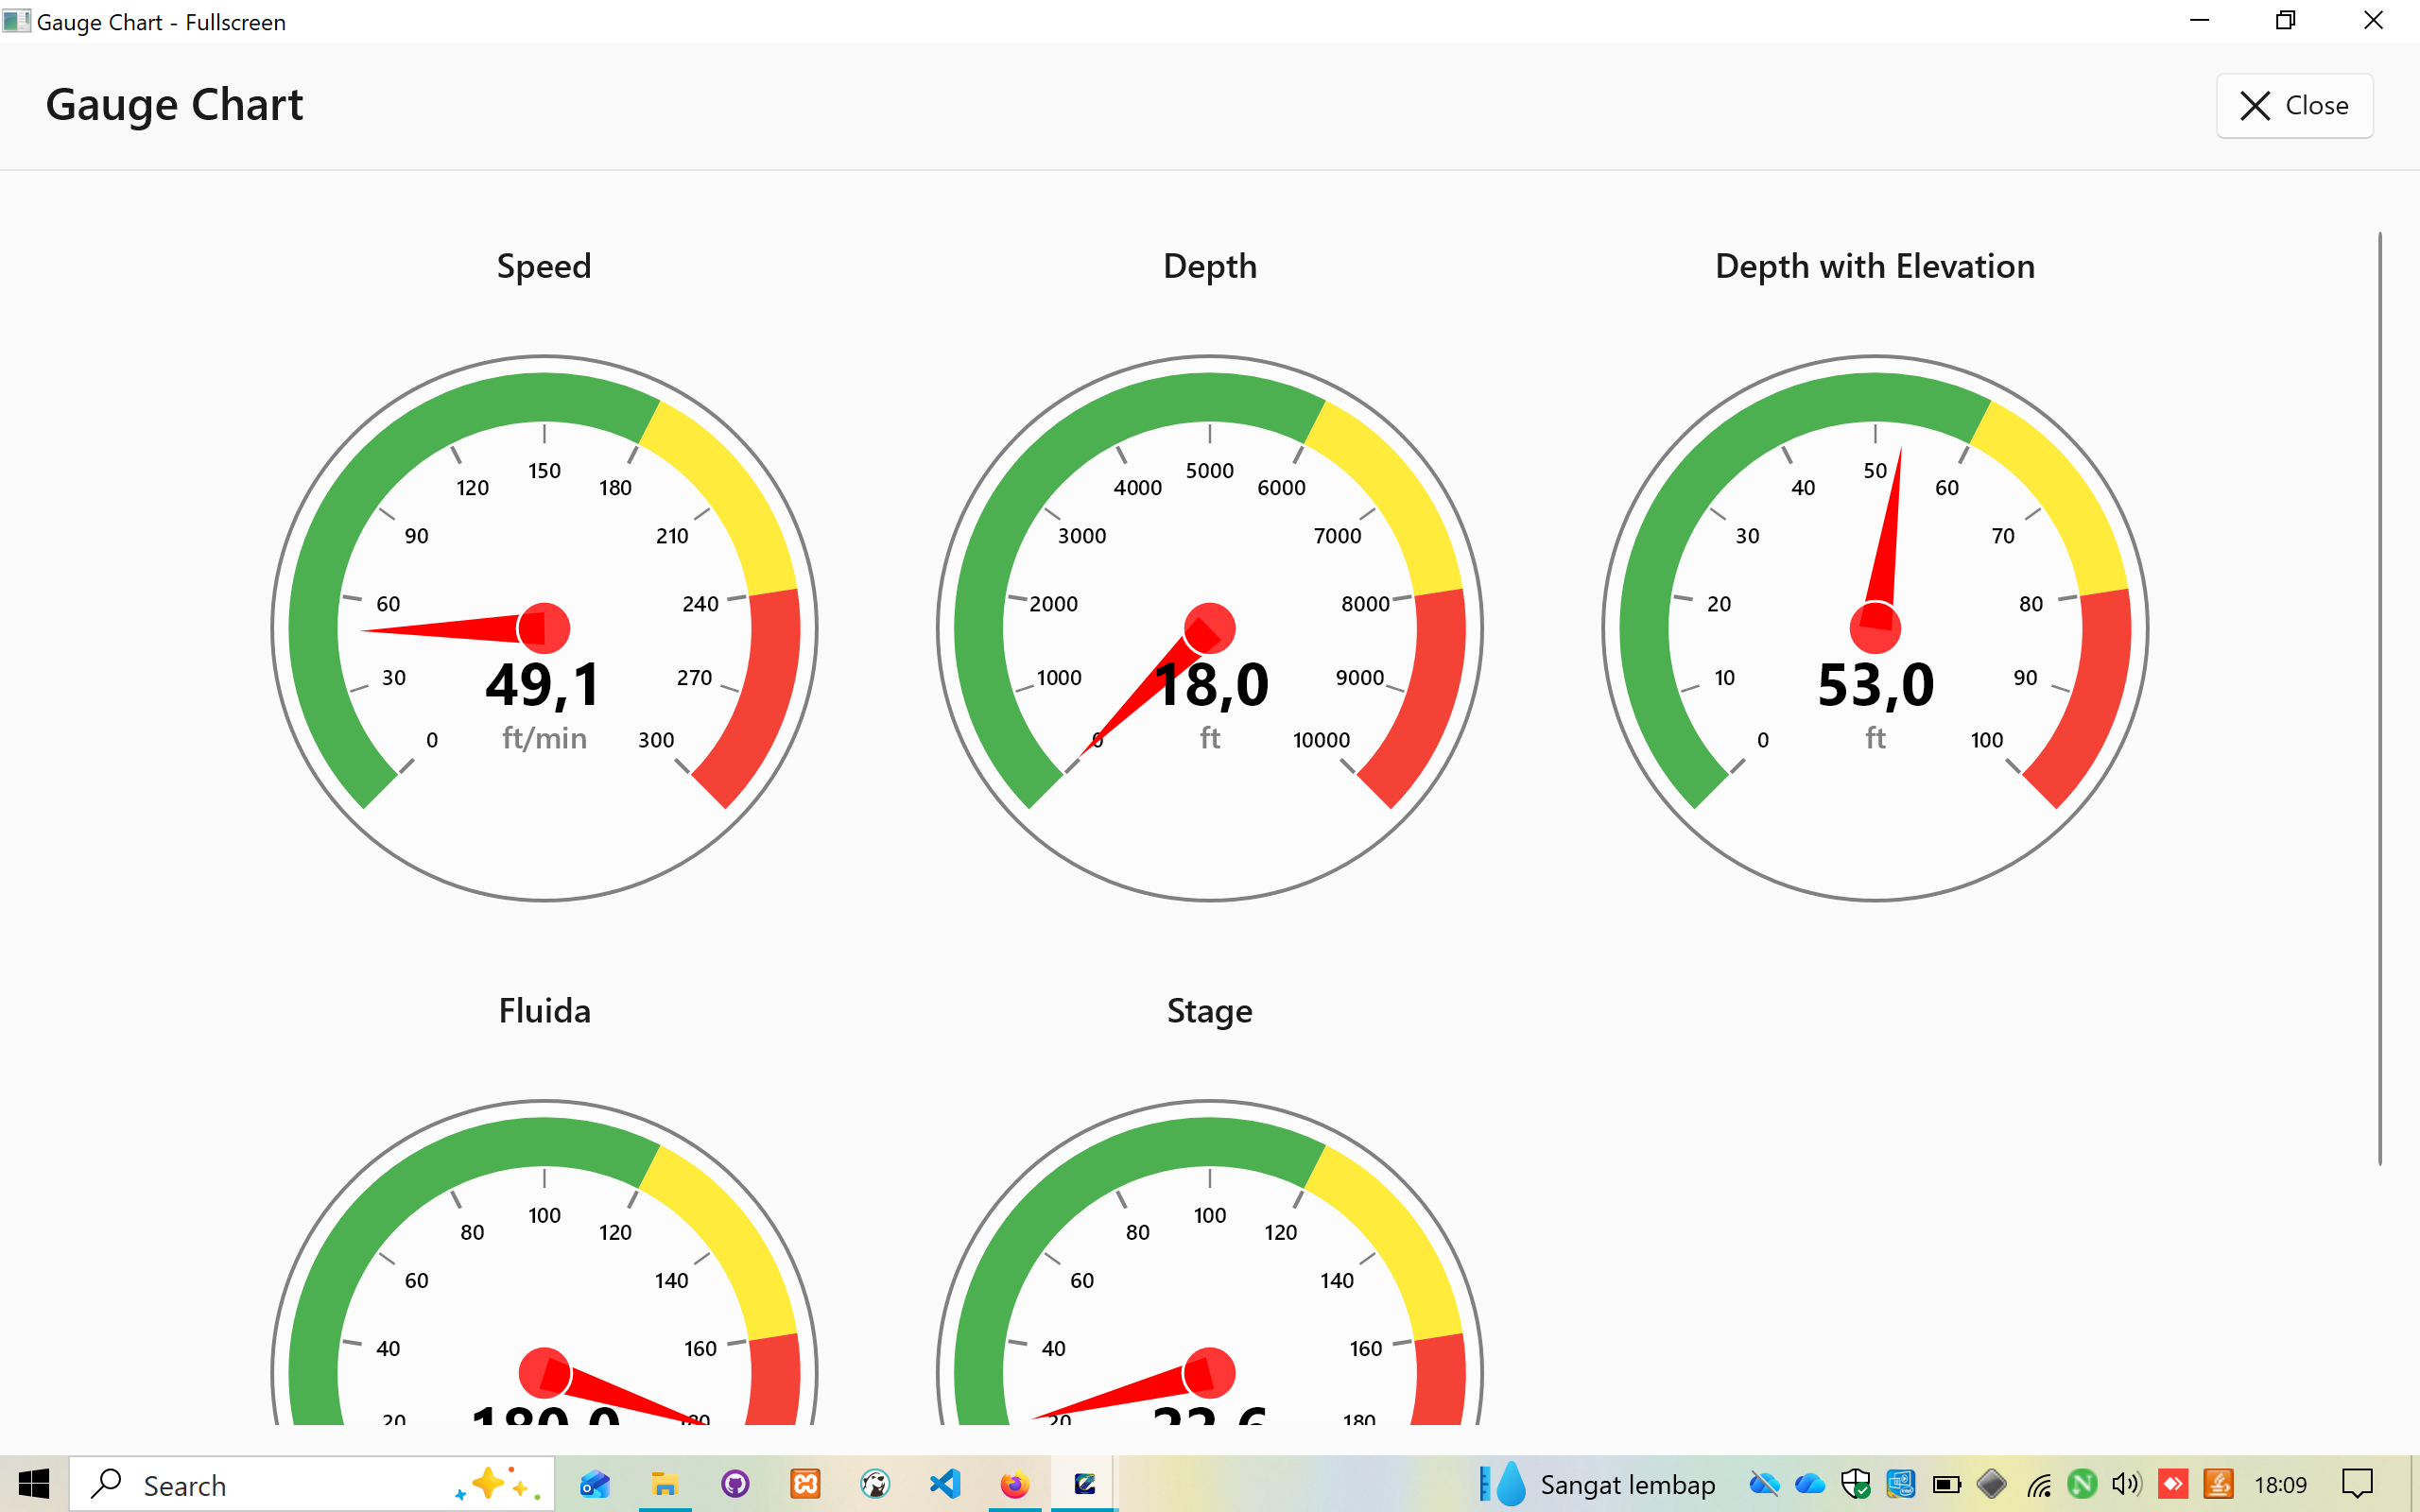
Fullscreen Features:
- Header: "Gauge Chart"
- Close button (top right)
- Expanded view of all configured gauges
- Grid layout (3 columns)
- Visible gauges:
- Speed: 49.1 ft/min
- Depth: 18.0 ft
- Depth with Elevation: 53.0 ft
- Fluida: 180.0
- Stage: 33.6
- (Additional gauges below)
Perfect for:
- Operator monitoring stations
- Field operations displays
- Real-time supervision
- Dashboard presentations
13. Line Chart View

Time-Series Chart Features:
- Multi-variable line display
- Dual Y-axis support (left and right)
- Color-coded lines:
- Blue shades for CT measurements
- Red shades for Fluida measurements
- Green for depth with elevation
- Additional colors for other variables
Chart Elements:
- Grid lines for easy reading
- Axis labels with units
- Legend showing all variables
- Page indicator: "Page 1 (858 points) - LIVE"
- Time range displayed on X-axis
Visible Variables:
- CT Speed (vertical spikes)
- CT Depth (increasing trend line)
- CT Depth with Elevation (parallel line)
- Fluida Rate (vertical variations)
- Fluida Stage (stepped increases)
- Fluida Total (cumulative line)
Navigation:
- Scroll for historical data
- Real-time updates in LIVE mode
- Pagination controls (if available)
14. Line Chart - Fullscreen
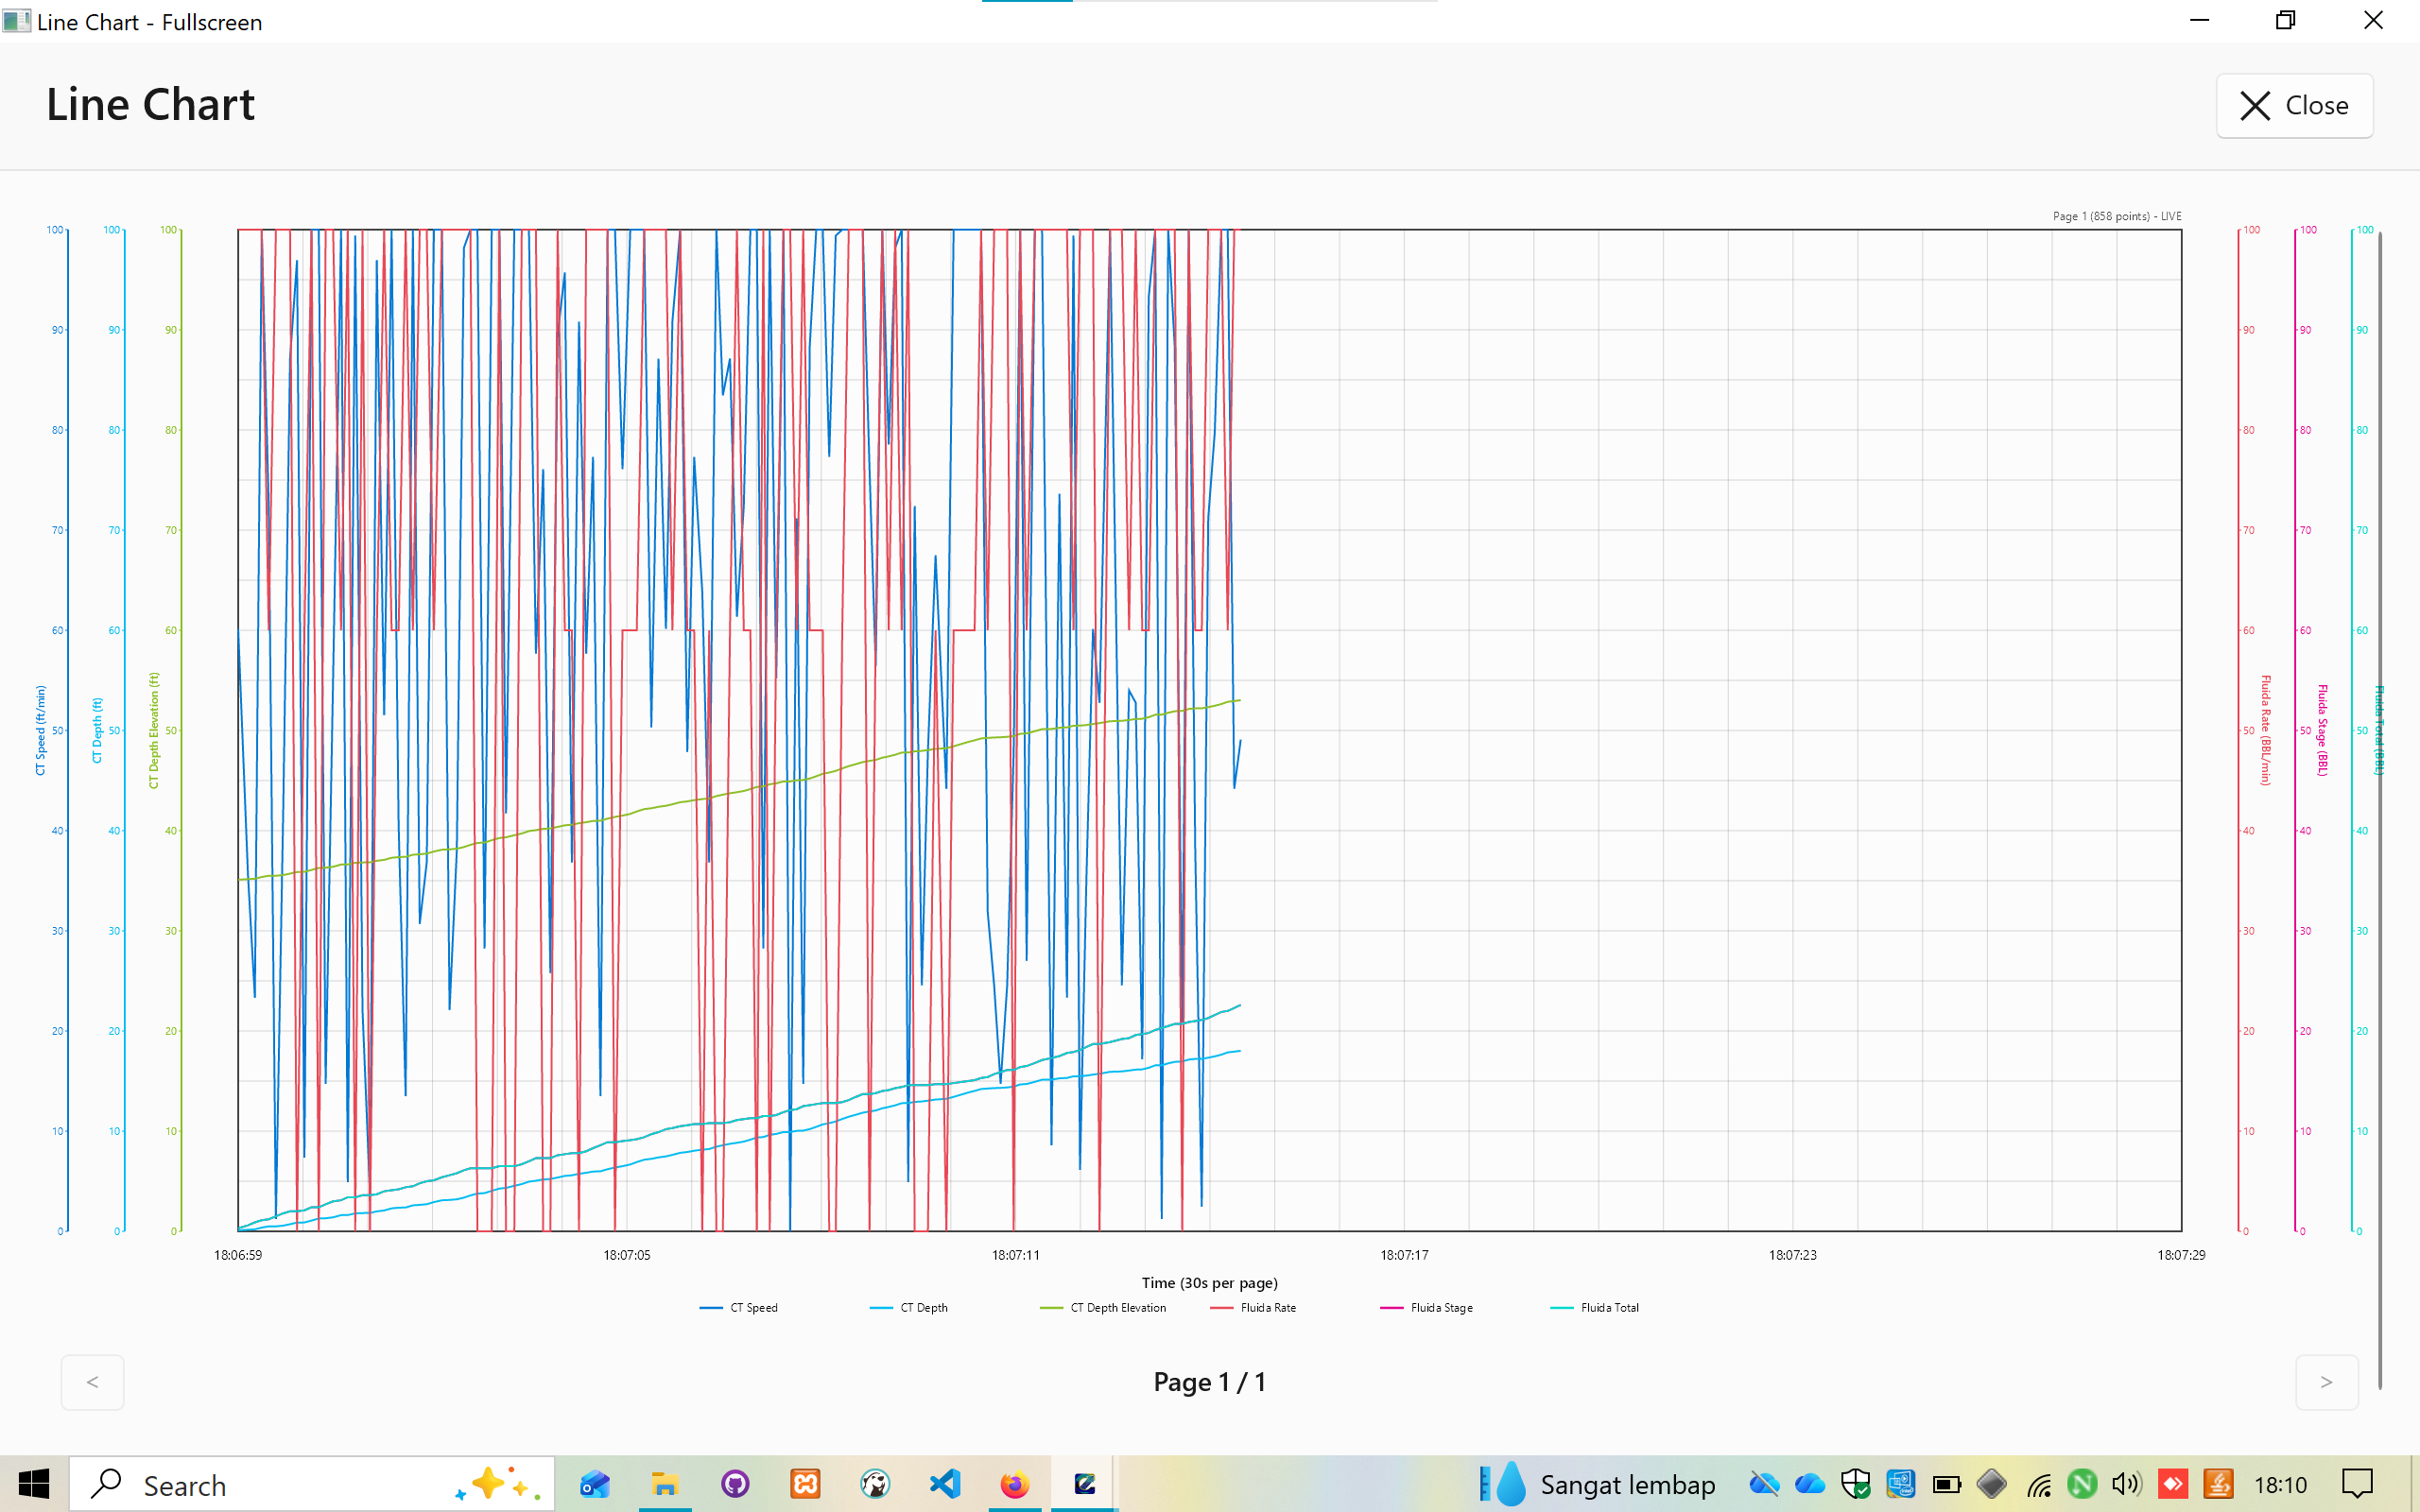
Expanded View Features:
- Full window chart display
- Clear time axis (30s per page default)
- Enhanced visibility of all data series
- Page navigation: "Page 1 of 1"
- Previous/Next buttons (< >)
Legend Display:
- CT Speed
- CT Depth
- CT Depth Elevation
- Fluida Rate
- Fluida Stage
- Fluida Total
Time Range:
- Displays timestamps on X-axis
- Example range: 18:06:59 to 18:07:29
Perfect for:
- Detailed data analysis
- Trend identification
- Historical playback review
- Report generation preparation
15. Main Display - Fullscreen
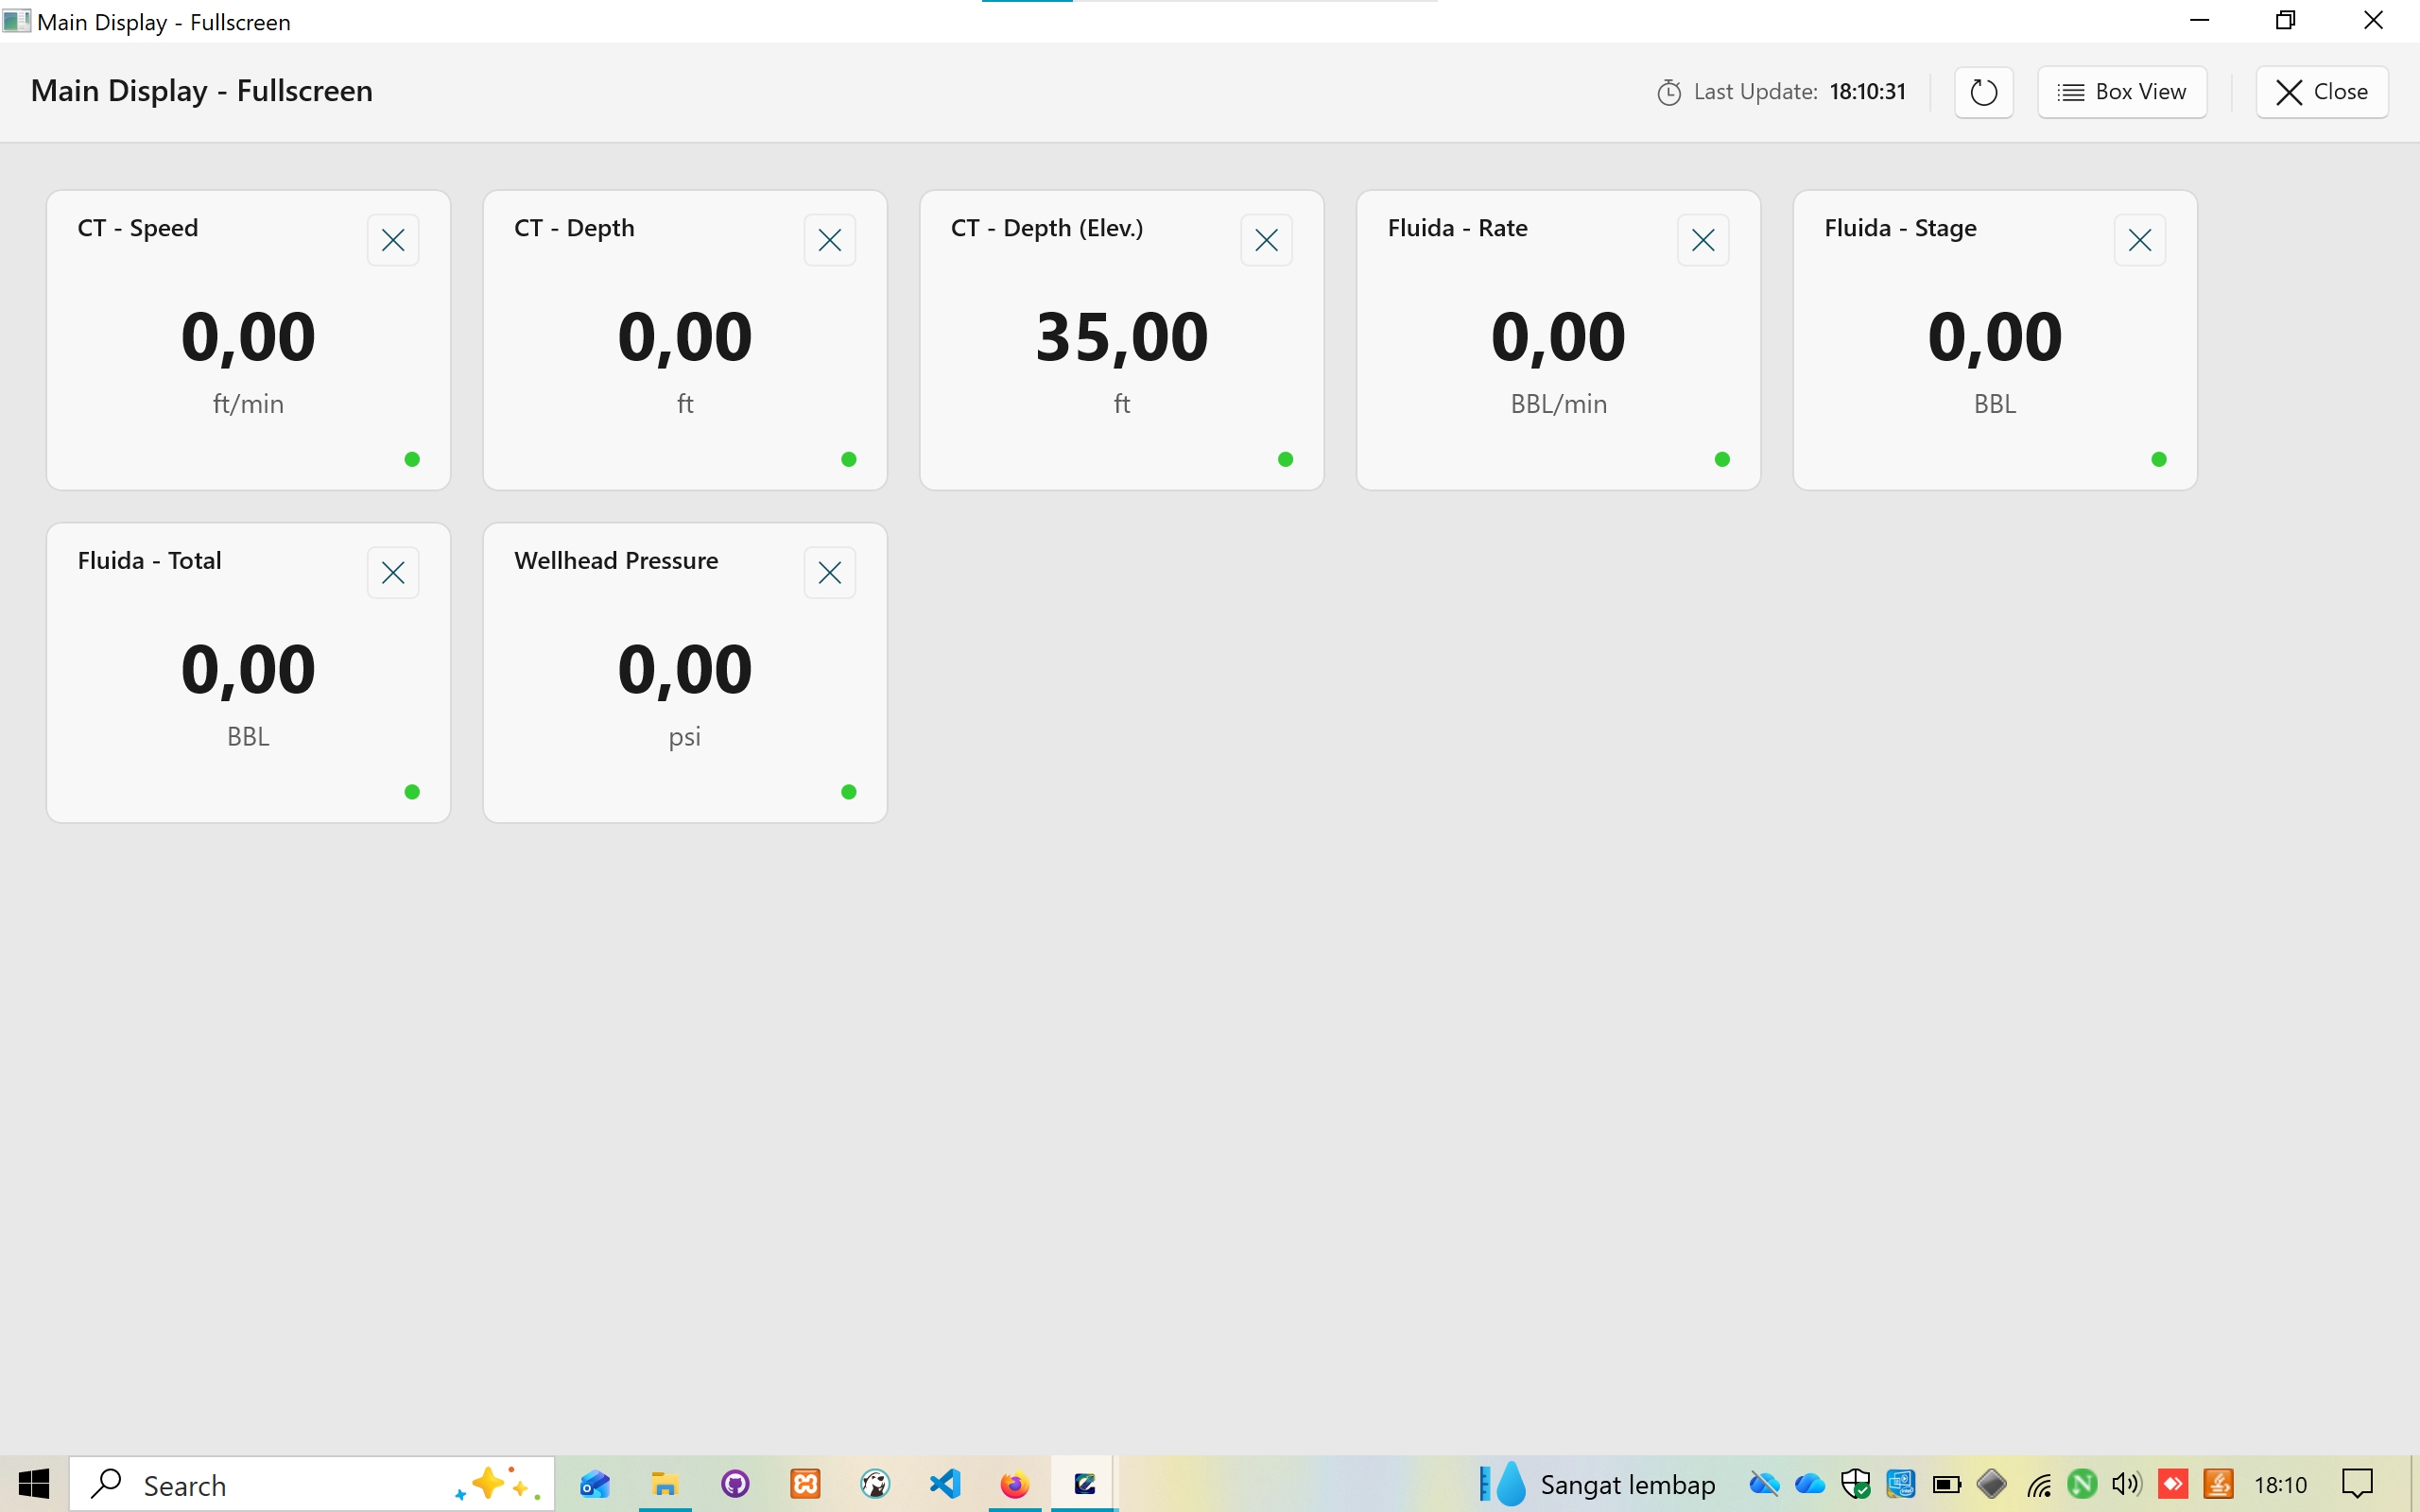
Fullscreen Box View:
- Large sensor value cards
- Clean, minimalist layout
- Easy-to-read values at a distance
Visible Sensor Cards:
- CT - Speed: 0.00 ft/min
- CT - Depth: 0.00 ft
- CT - Depth (Elev.): 35.00 ft
- Fluida - Rate: 0.00 BBL/min
- Fluida - Stage: 0.00 BBL
- Fluida - Total: 0.00 BBL
- Wellhead Pressure: 0.00 psi
Features:
- Status indicators (green dots)
- Remove card option (X button on each card)
- Last Update timestamp (18:10:31)
- Box View toggle
- Close button
Ideal for:
- Control room displays
- Field operation monitoring
- Large screen presentations
- Quick status overview
Configuration Management
Device Connection Setup
Purpose: Configure communication with Opto 22 SNAP UP1 ADS hardware
Steps:
- Click "Connect" button in main interface
- Select device type from dropdown
- Enter Host/IP Address
- Configure Port number
- Set Timeout value
- Click "Test Connection" to verify
- Save configuration
Best Practices:
- Use static IP addresses for hardware devices
- Increase timeout for networks with high latency
- Test connection before starting recording
- Document IP addresses for field deployment
General Data Entry
Purpose: Record job and well information for reports
Required Information:
- Customer and representative details
- Well identification (number, API, zone)
- Location data
- Service dates and equipment
Usage:
- Populated data appears in Excel/PDF exports
- Information stored per monitoring file
- Can be edited at any time
- Helps with record organization
I/O Device Configuration
Purpose: Define sensor connections and signal types
Configuration Process:
- Click "I/O Configuration" button
- Click "New" to add sensor
- Enter tag name and description
- Select signal type
- Configure pin addresses
- For encoders: set PPR and gear ratio
- Enable the sensor
- Click "Update" to save
Signal Type Guidelines:
Digital (Encoder ABC):
- Use for rotational speed measurement
- Requires A, B, A Complement, B Complement pins
- Must configure PPR and gear ratio
- Common for CT speed and depth
Analog Standard:
- Use for pressure and flow sensors
- Single pin configuration
- 4-20mA or 0-10V signals
- Scaling applied in software
Digital Magnetic Pickup:
- Use for frequency-based measurements
- Pulse counting for flow meters
- Single or dual pin configuration
Chart Setup
Gauge Chart Configuration:
- Click "Chart Setup" button
- Select "Gauge Chart" or create new
- Click "Add Gauge Variable"
- Select variable from I/O configuration
- Set Warning threshold
- Set Critical threshold
- Define Min/Max range
- Choose unit display
- Save variable
Color Zones:
- Green: 0 to Warning threshold
- Yellow: Warning to Critical threshold
- Red: Critical to Maximum
Line Chart Configuration:
- Select "Line Chart" from configurations
- Add variable
- Enter display name
- Choose Y-axis side (Left/Right)
- Select line color from palette
- Adjust line thickness
- Enable/disable in chart
- Save variable
Best Practices:
- Use left axis for similar-unit variables
- Use right axis for different-unit variables
- Choose contrasting colors for clarity
- Limit to 7 variables per chart for readability
Export Capabilities
Excel Export (ClosedXML)
Features:
- Professional formatting with headers
- Custom column selection
- Auto-generated filenames with timestamps
- Default export location: Documents\CoiledTubingExports
Export Structure:
Header Information (Sheet 1):
- Record metadata
- Customer information
- Well data
- Location details
- Service information
Readings Data (Sheet 2):
- Timestamp column
- Record name
- All selected sensor variables with units
- Color-coded columns
- Frozen header row
- Auto-width columns
Statistical Summary:
- Minimum values
- Maximum values
- Average values
- Calculated formulas
Export Options:
- All readings vs current record
- Column selection via checkboxes
- Estimated row count preview
- Selected columns count
- Browse for custom save location
PDF Report (QuestPDF)
Report Types:
1. Chart Report:
- Header with application logo
- Project and record information
- Gauge chart snapshots (grid layout)
- Line chart pages (multi-page support)
- Summary statistics table
- Page numbers and timestamps in footer
2. List/Table Report:
- Tabular data presentation
- Alternating row colors for readability
- Auto-pagination for large datasets
- Compact format
- Professional styling
Export Options:
- Export Range:
- All Sensor Readings
- Current Record Only
- Custom Time Range
- Report Type Selection:
- Chart Report (visual)
- List/Table Report (data-focused)
- Chart Configuration Selection:
- Select All / Deselect All
- Individual chart selection
- Gauge charts
- Line charts
PDF Styling:
- Custom fonts (Arial/Segoe UI)
- Professional margins and spacing
- High-quality chart rendering
- Brand-consistent color schemes
- Page headers and footers
Installation & Deployment
Build System
The project uses MSIX packaging for modern Windows app distribution.
Build Features:
- Code signing with certificate
- Automatic version incrementing
- Asset optimization
- Dependencies bundling
- One-click deployment
Installation Options
1. MSIX Package (Recommended)
- Modern Windows app package
- Double-click installation
- Automatic update support
- Clean uninstallation
- Windows Store ready
- App isolation and security
Advantages:
- Best user experience
- Automatic updates
- Clean installs/uninstalls
- Modern security model
Requirements:
- Windows 10 version 1809+ or Windows 11
- .NET 8 Desktop Runtime (bundled)
- 100 MB disk space
- 4 GB RAM minimum
2. WiX Installer (MSI)
- Traditional Windows installer
- Custom installation path
- Registry integration
- System-wide deployment
- Group Policy support
Use Cases:
- Enterprise deployment
- Custom installation paths
- System-wide configuration
- IT-managed environments
3. Inno Setup (EXE)
- Lightweight installer
- Customizable wizard
- Portable option available
- Legacy Windows support
- Minimal dependencies
Use Cases:
- Legacy system support
- USB stick deployment
- Offline installation
- Custom branding
System Requirements
Minimum:
- Windows 10 (Build 17763) or later
- .NET 8 Desktop Runtime
- 100 MB disk space
- 4 GB RAM
- 1280x720 display resolution
- Network adapter (for hardware connection)
Recommended:
- Windows 11
- 8 GB RAM
- SSD storage
- 1920x1080 display resolution
- Gigabit Ethernet for hardware communication
License Activation
Activation Process:
- Install Coil Matrix Pro
- Launch application
- Enter Installation Key when prompted
- Hardware ID automatically detected
- License validated
- Application activated
License Information:
- Tied to specific hardware ID
- Generated from: Motherboard + CPU + MAC Address
- Offline activation supported
- One-time activation per device
- No internet required after activation
License Types:
- Single Device: 1 hardware ID, lifetime updates
- Site License: Up to 10 devices, priority support
- Enterprise: Unlimited devices, custom features
Security Features
Anti-Crack Strategy
The application implements multi-layer protection:
1. Hardware ID Binding
- License tied to unique hardware identifier
- Generated from:
- Motherboard serial number
- CPU ID
- Primary MAC address
- Hash-based verification
- Prevents license sharing between devices
2. Code Obfuscation
- Critical sections obfuscated
- Anti-debugging techniques
- Control flow obfuscation
- String encryption
- Method name mangling
3. Integrity Checks
- Assembly verification at runtime
- Tamper detection mechanisms
- Checksum validation
- Digital signature verification
4. Encrypted Storage
- License keys encrypted with AES-256
- Database files protected
- Configuration files secured
- Sensitive data never in plain text
5. Online Validation (Optional)
- Periodic license server checks
- Revocation list support
- Stolen license detection
- Usage analytics (anonymous)
Protection Against:
- Key generators
- Crack patches
- Debug manipulation
- Memory editing
- Binary modification
- Virtual machine detection
Database Schema
SQLite Structure
Normalized Database Design
Tables:
1. MonitoringFiles
- FileId (Primary Key)
- FileName
- FilePath
- RecordName
- Description
- CreatedDate
- ModifiedDate
- FileSize
2. Records
- RecordId (Primary Key)
- FileId (Foreign Key)
- RecordName
- StartTimestamp
- EndTimestamp
- TotalDataPoints
- IsActive
3. SensorReadings
- ReadingId (Primary Key)
- RecordId (Foreign Key)
- Timestamp
- CTSpeed
- CTDepth
- CTDepthElevation
- FluidaRate
- FluidaStage
- FluidaTotal
- WellheadPressure
4. DeviceConfigurations
- ConfigId (Primary Key)
- RecordId (Foreign Key)
- DeviceType
- HostAddress
- Port
- Timeout
- LastConnected
5. IODevices
- DeviceId (Primary Key)
- RecordId (Foreign Key)
- TagName
- Description
- SignalType
- PinAddressA
- PinAddressB
- PinAddressAComplement
- PinAddressBComplement
- PPR
- GearRatio
- IsEnabled
6. ChartConfigurations
- ChartId (Primary Key)
- RecordId (Foreign Key)
- ChartName
- ChartType
- Description
- ConfigurationJSON
7. GeneralData
- GeneralDataId (Primary Key)
- RecordId (Foreign Key)
- CustomerName
- CustomerRepresentative
- BJRepresentative
- JobNumber
- LeaseName
- WellNumber
- APINumber
- Zone
- Location
- Country
- State
- DCSGLegalDescription
- ServiceStartDate
- ServiceEndDate
- ServiceType
- Equipment
Key Features:
- Foreign key constraints for referential integrity
- Indexes on frequently queried columns
- Timestamp indexing for performance
- RecordId indexing for fast lookups
- Transaction support (ACID compliance)
- Version-controlled schema migrations
Performance Optimizations:
- Batch inserts for recordings
- Connection pooling
- Query result caching
- Lazy loading for charts
- Indexed timestamps
Performance Optimization
Data Acquisition
Polling Strategy:
- Configurable interval (default 100ms)
- Balance between responsiveness and CPU usage
- Adaptive polling based on data rate
- Skip polling if no data changes
Threading Model:
- Background thread for data acquisition
- Async/await pattern throughout
- Non-blocking UI operations
- Thread-safe data structures
Buffer Management:
- Circular buffer for incoming data
- Prevents memory leaks in long recordings
- Configurable buffer size
- Automatic overflow handling
Database Operations
Write Optimization:
- Batch inserts (commit every 100 readings)
- Transaction batching
- Prepared statements
- Write-ahead logging (WAL mode)
Read Optimization:
- Connection pooling
- Query result caching
- Indexed columns for fast retrieval
- Pagination for large datasets
Query Examples:
-- Optimized for timestamp range queries
CREATE INDEX idx_readings_timestamp
ON SensorReadings(Timestamp);

-- Optimized for record lookups
CREATE INDEX idx_readings_recordid
ON SensorReadings(RecordId);
Chart Rendering
LiveCharts Performance:
- Hardware acceleration enabled
- GPU rendering when available
- Render throttling (max 60 FPS)
- Efficient data point updates
Data Decimation:
- Downsampling for large datasets
- Maintain visual accuracy
- Reduce rendering load
- Configurable decimation factor
Virtualization:
- Only render visible data points
- Lazy loading for historical data
- Viewport-based rendering
- Memory-efficient scrolling
Update Strategies:
- Incremental updates vs full redraw
- Dirty region tracking
- Batch update scheduling
- Animation frame optimization
Memory Management
Best Practices:
- Dispose resources properly
- Weak event handlers
- Unsubscribe from events
- Clear collections when done
- Use object pooling for frequent allocations
Monitoring:
- Built-in memory profiling hooks
- Leak detection in debug builds
- Performance counters
- Resource usage tracking
Troubleshooting
Common Issues
1. Device Connection Failed
Symptoms:
- "Not Connected" status indicator
- Unable to poll data from hardware
- Timeout errors
Possible Causes:
- Incorrect IP address or port
- Network firewall blocking connection
- Opto 22 device offline or not configured
- Timeout value too short for network latency
- Physical network cable disconnected
Solutions:
- Verify IP Address:
- Open command prompt
- Run:
ping 192.168.1.50(use your device IP) - Verify device responds
- Check Firewall Rules:
- Open Windows Firewall settings
- Allow port 2001 (or configured port)
- Add exception for Coil Matrix Pro
- Increase Timeout:
- Open Connect Device Configuration
- Increase timeout to 10000ms (10 seconds)
- Save and test connection
- Use Dummy Mode:
- Enable dummy simulation for testing
- Verify application functionality
- Isolate hardware vs software issues
- Check Hardware:
- Verify Opto 22 device power
- Check network cable connections
- Verify device configuration
2. Export Fails
Symptoms:
- Error message during export
- File not created
- Export process hangs
Possible Causes:
- File already open in Excel/PDF reader
- Insufficient disk space
- Invalid characters in filename
- Permissions issue on export folder
- Antivirus blocking file creation
Solutions:
- Close Existing Files:
- Close Excel or PDF reader
- Check Task Manager for hidden instances
- Retry export
- Check Disk Space:
- Verify available space on drive
- Clear temporary files if needed
- Export to different location
- Use Default Filename:
- Don't modify auto-generated filename
- Use default Documents\CoiledTubingExports folder
- Retry export
- Check Permissions:
- Ensure write permissions on export folder
- Try exporting to Desktop
- Run application as administrator (if needed)
- Disable Antivirus Temporarily:
- Temporarily disable real-time protection
- Retry export
- Add exception for Coil Matrix Pro
- Re-enable antivirus
3. License Activation Error
Symptoms:
- "Invalid License Key" message
- Application won't start
- License expired error
Possible Causes:
- Invalid installation key
- Hardware ID mismatch
- System clock incorrect
- Corrupted license file
- Hardware changes (motherboard, CPU, network card)
Solutions:
- Verify Installation Key:
- Check email for correct key
- Ensure no extra spaces when copying
- Use copy-paste instead of manual entry
- Contact support for key verification
- Check Hardware ID:
- Hardware changes invalidate license
- Re-generate hardware ID
- Request new license key for new hardware
- Sync System Time:
- Verify system date and time
- Enable automatic time synchronization
- Correct timezone settings
- Restart application
- Reinstall Application:
- Completely uninstall Coil Matrix Pro
- Delete residual files
- Reinstall from original installer
- Re-activate with installation key
- Contact Support:
- Provide hardware ID
- Provide error details
- Request new activation key
- Technical support available
4. Application Crashes or Freezes
Symptoms:
- Application stops responding
- Sudden crashes during operation
- Slow performance
Possible Causes:
- Insufficient memory
- Corrupted database file
- Conflicting software
- Driver issues
Solutions:
- Close Other Applications:
- Free up system memory
- Close unnecessary background apps
- Restart computer
- Check Database Integrity:
- Use SQLite database repair tools
- Backup database before repair
- Create new monitoring file if corrupted
- Update Drivers:
- Update graphics drivers
- Update network drivers
- Install Windows updates
- Reinstall .NET Runtime:
- Download .NET 8 Desktop Runtime
- Repair or reinstall runtime
- Restart computer
5. Charts Not Displaying
Symptoms:
- Blank chart areas
- Charts not updating
- Visual glitches
Possible Causes:
- Graphics driver incompatibility
- Hardware acceleration disabled
- Insufficient GPU memory
Solutions:
- Update Graphics Drivers:
- Download latest drivers from manufacturer
- Install and restart
- Test chart display
- Enable Hardware Acceleration:
- Check Windows graphics settings
- Enable GPU acceleration
- Restart application
- Reduce Chart Complexity:
- Limit number of variables
- Reduce line thickness
- Increase polling interval
6. Data Recording Issues
Symptoms:
- Recording doesn't start
- Data not saved to database
- Playback not working
Possible Causes:
- Database locked by another process
- Insufficient disk space
- File permissions
Solutions:
- Check Database Lock:
- Close other instances of application
- Ensure database file not open elsewhere
- Restart application
- Verify Disk Space:
- Ensure adequate free space
- Database grows with recording time
- Plan for long recording sessions
- Check File Permissions:
- Ensure write access to database location
- Move database to different folder if needed
- Run as administrator if required
Future Enhancements
Planned Features
Cloud Integration:
- Optional cloud backup for monitoring files
- Real-time data sync across devices
- Web-based dashboard for remote monitoring
- Cloud storage for historical data
Multi-language Support:
- English (default)
- Indonesian
- Arabic
- Spanish
- Chinese
Advanced Analytics:
- Statistical analysis tools
- Trend detection algorithms
- Predictive maintenance alerts
- Machine learning integration
- Anomaly detection
Mobile Companion App:
- Android and iOS applications
- Remote monitoring capabilities
- Push notifications for alerts
- Real-time data viewing
- Simplified controls
API Integration:
- REST API for third-party systems
- WebSocket for real-time updates
- Export API for automated reporting
- Integration with SCADA systems
- Custom plugin support
Enhanced Reporting:
- Report template builder
- Drag-drop report designer
- Custom branding options
- Scheduled automatic reports
- Email report delivery
Alarm System:
- Configurable threshold alarms
- Visual and audio alerts
- SMS/Email notifications
- Alarm history logging
- Escalation procedures
Advanced Playback:
- Timeline scrubbing
- Variable playback speeds
- Frame-by-frame navigation
- Bookmark important moments
- Export video of playback
Data Sync:
- Multi-device synchronization
- Conflict resolution
- Offline mode with sync
- Version control for configurations
Custom Export Templates:
- User-defined Excel templates
- Custom PDF layouts
- Branding customization
- Multiple template profiles
Technology Upgrades
Framework Upgrades:
- Migrate to .NET 9 (Long-term support)
- Upgrade WinUI 3 to latest stable version
- Implement .NET MAUI for cross-platform support
Communication Protocols:
- Implement gRPC for device communication (faster than TCP)
- Add MQTT support for IoT integration
- OPC UA for industrial automation standards
Real-time Features:
- Integrate SignalR for real-time web dashboard
- WebSocket support for live streaming
- Server-Sent Events (SSE) for updates
Machine Learning:
- ML.NET integration for predictive maintenance
- Pattern recognition for anomaly detection
- Automated threshold recommendations
- Failure prediction models
Performance:
- SIMD acceleration for data processing
- GPU compute for complex calculations
- Multi-threaded chart rendering
- Improved memory management
Security:
- OAuth 2.0 authentication for cloud features
- TLS 1.3 for encrypted communications
- Hardware security module (HSM) support
- Blockchain-based license management
Support & Licensing
Commercial License
Coil Matrix Pro is proprietary software requiring a paid license for production use.
License Types:
1. Single Device License
- Features:
- 1 hardware ID activation
- Lifetime software updates
- Email support
- Standard response time (24 hours)
- Access to documentation
- Bug fixes included
- Best For:
- Individual operators
- Single rig operations
- Testing and evaluation
- Small contractors
2. Site License
- Features:
- Up to 10 devices
- Lifetime software updates
- Priority support (4-hour response)
- Phone support included
- Custom training session
- Configuration assistance
- Quarterly check-ins
- Best For:
- Small to medium operations
- Multiple rigs at one site
- Growing companies
- Regional contractors
3. Enterprise License
- Features:
- Unlimited devices
- Lifetime software updates
- Premium support (1-hour response)
- 24/7 phone support
- Dedicated account manager
- Custom feature development
- On-site training
- Integration assistance
- Annual reviews
- Best For:
- Large corporations
- Multi-site operations
- International companies
- Custom requirements
Pricing:
- Contact for quotation
- Volume discounts available
- Multi-year agreements
- Flexible payment terms
Technical Support
Support Channels:
- Email Support: Available for all license types
- Phone Support: Site and Enterprise licenses
- Remote Desktop: For complex issues
- On-site Support: Enterprise license (additional fee)
Response Times:
Critical Issues (Application won't start, data loss):
- Single Device: 24 hours
- Site License: 4 hours
- Enterprise: 1 hour
High Priority (Major features not working):
- Single Device: 48 hours
- Site License: 8 hours
- Enterprise: 4 hours
Standard Issues (Minor bugs, questions):
- Single Device: 3 business days
- Site License: 24 hours
- Enterprise: 8 hours
Feature Requests:
- All licenses: Reviewed quarterly
- Enterprise: Priority consideration
Support Includes:
- Installation assistance
- Configuration guidance
- Troubleshooting
- Best practices advice
- Update assistance
- License management
Support Does NOT Include:
- Hardware troubleshooting (Opto 22 devices)
- Network infrastructure issues
- Operating system problems
- Third-party software conflicts
- Training on basic Windows operations
Updates & Maintenance
Bug Fixes:
- Free for all licensed users
- Released as needed
- Automatic update notification
- Optional automatic installation
Minor Updates (Feature additions, improvements):
- Included in all license types
- Released quarterly
- Backward compatible
- Optional installation
Major Versions (Significant rewrites):
- Major version upgrades may require upgrade fee
- Discounted pricing for existing customers
- Migration assistance included
- Data compatibility maintained
Security Patches:
- Always free for all users
- Released immediately when needed
- Strongly recommended installation
- May be automatically applied
Long-term Support:
- Each major version supported for 3 years
- Extended support available for Enterprise
- Security updates for 5 years
- Legacy version access maintained
Warranty & Disclaimers
Software Warranty:
- 90-day warranty against defects
- Replacement or refund if defective
- No warranty for misuse or modifications
Liability Limitations:
- Software provided "as-is" beyond warranty
- No liability for operational decisions based on data
- User responsible for data accuracy verification
- Maximum liability limited to license fee paid
Data Responsibility:
- User responsible for data backups
- User responsible for data accuracy
- User responsible for regulatory compliance
- Application is a tool, not a certified safety system
Best Practices
Operational Guidelines
Before Starting Operations:
- Test hardware connection
- Verify all sensors configured correctly
- Check gauge chart thresholds
- Ensure adequate disk space
- Create backup of previous data
- Document configuration settings
During Operations:
- Monitor connection status indicator
- Verify data is being recorded (Data Points count)
- Check Last Update timestamp regularly
- Monitor for warning/critical threshold breaches
- Use fullscreen mode for better visibility
- Keep application window focused for best performance
After Operations:
- Stop recording properly (don't force close)
- Export data to Excel/PDF immediately
- Backup database files
- Review data for anomalies
- Document any issues or notes
- Archive monitoring files properly
Data Management
File Organization:
- Use consistent naming conventions
- Include date and job number in filenames
- Organize by customer/well/date hierarchy
- Regular backups to external storage
- Cloud backup for critical data
Database Maintenance:
- Regular database optimization (monthly)
- Check database integrity periodically
- Archive old monitoring files
- Delete test/dummy recordings
- Monitor database file sizes
Export Strategy:
- Export immediately after recording
- Keep both Excel and PDF copies
- Store exports separately from database
- Use descriptive filenames
- Include metadata in exports
Configuration Management
Save Configurations:
- Document standard sensor setups
- Save common chart configurations
- Maintain configuration templates
- Version control configuration changes
- Share configurations across team
Backup Configurations:
- Export configuration settings
- Document custom thresholds
- Save device connection settings
- Keep configuration history
- Test configurations before deployment
Security Best Practices
License Management:
- Protect installation keys
- Document hardware IDs
- Track license assignments
- Report stolen devices immediately
- Maintain license inventory
Access Control:
- Restrict application access to operators
- Use Windows user accounts
- Protect database files
- Secure backup storage
- Monitor for unauthorized access
Network Security:
- Use private networks for hardware communication
- Implement firewall rules
- Use VPN for remote access
- Secure Wi-Fi if used
- Document network configuration
Performance Tips
Optimize Polling:
- Use appropriate polling intervals (100-500ms)
- Disable polling when not needed
- Reduce chart update frequency if sluggish
- Close unused fullscreen windows
- Limit number of active charts
System Resources:
- Close unnecessary applications
- Ensure adequate RAM available
- Use SSD for database storage
- Regular Windows maintenance
- Keep drivers updated
Data Recording:
- Start recording before operations begin
- Stop recording after operations complete
- Don't interrupt recording forcefully
- Monitor disk space during long recordings
- Use data decimation for very long recordings
Conclusion
Coil Matrix Pro represents a comprehensive, industrial-grade solution for coiled tubing operations in the oil & gas industry. The application successfully combines robust hardware integration, intuitive user interface design, and powerful data management capabilities into a single professional package.
Key Achievements
✅ Reliability
- Industrial-grade hardware support (Opto 22 SNAP UP1 ADS)
- Proven stable in field operations
- Automatic reconnection mechanisms
- Data integrity through SQLite ACID compliance
- Comprehensive error handling
✅ Performance
- Optimized for real-time data acquisition (100ms polling)
- Efficient database operations (batch inserts, indexed queries)
- Smooth chart rendering with hardware acceleration
- Low memory footprint
- Responsive UI even during intensive operations
✅ Security
- Multi-layer license protection system
- Hardware ID binding prevents piracy
- Encrypted storage for sensitive data
- Code obfuscation for critical sections
- Tamper detection mechanisms
✅ Usability
- Modern WinUI 3 interface with Fluent Design
- Intuitive configuration dialogs
- Fullscreen modes for field operations
- Clear status indicators and feedback
- Minimal training required
✅ Flexibility
- Configurable for various sensor types
- Support for multiple signal types (Digital, Analog)
- Customizable chart configurations
- Flexible export options
- Dummy simulation mode for testing
✅ Portability
- Export data in industry-standard formats (Excel, PDF)
- Professional reports with custom branding
- Comprehensive data export options
- Easy data sharing and archival
- Compatible with existing workflows
Industry Impact
Coil Matrix Pro has been designed with real-world field operations in mind:
- Operational Efficiency: Real-time monitoring enables immediate response to critical conditions
- Data Integrity: Reliable recording ensures complete operational records
- Regulatory Compliance: Comprehensive reports meet industry documentation requirements
- Cost Savings: Reduced data loss and improved decision-making
- Safety Enhancement: Warning thresholds and visual indicators improve operational safety
Technical Excellence
The application demonstrates strong software engineering principles:
- Modern Architecture: Clean separation of concerns with MVVM pattern
- Maintainability: Well-structured codebase with clear documentation
- Scalability: Designed to handle growing data volumes and feature additions
- Extensibility: Plugin-ready architecture for future enhancements
- Best Practices: Follows .NET and WinUI 3 development guidelines
Looking Forward
With planned enhancements including cloud integration, mobile companion apps, advanced analytics, and machine learning capabilities, Coil Matrix Pro is positioned to evolve alongside industry needs and technological advancements.
The application's solid foundation, combined with ongoing development and support, ensures it will remain a valuable tool for coiled tubing operations for years to come.
Contact Information
Developer: Fauzan Nur Hidayat
Company: Coil Matrix Pro
Year: 2025
License: Proprietary
Version: 1.0.0
For Sales & Licensing:
- Contact for quotation and licensing information
- Volume discounts available
- Custom feature development
- Enterprise agreements
For Technical Support:
- Email support included with all licenses
- Phone support for Site and Enterprise licenses
- Remote assistance available
- Comprehensive documentation provided
For Feature Requests:
- Submit via support channel
- Enterprise customers receive priority
- Quarterly review of all requests
- Custom development available
Appendix
Glossary
API Number: American Petroleum Institute well identification number
BBL: Barrel (42 US gallons), standard unit for oil and gas volumes
Coiled Tubing (CT): Continuous steel pipe wound on a reel for well intervention
DCSG: Surface location description format
Encoder ABC: Quadrature encoder with A, B, and complement channels
Fluida: Fluid (Indonesian term retained in application)
ft: Feet, unit of depth measurement
ft/min: Feet per minute, unit of speed
Lease: Oil and gas property under a single operator
MSIX: Modern Windows app packaging format
Opto 22 SNAP: Industrial I/O data acquisition system
PPR: Pulses Per Revolution, encoder configuration parameter
psi: Pounds per square inch, pressure unit
Wellhead: Surface equipment at the top of a well
Abbreviations
ADS: Analog and Digital System
API: Application Programming Interface (or American Petroleum Institute)
BJ: Baker Hughes (service company)
CSV: Comma-Separated Values
EXE: Executable file format
GUI: Graphical User Interface
I/O: Input/Output
IP: Internet Protocol
MSI: Microsoft Installer
MVVM: Model-View-ViewModel
ORM: Object-Relational Mapping
PDF: Portable Document Format
SCADA: Supervisory Control and Data Acquisition
SQL: Structured Query Language
TCP: Transmission Control Protocol
UI: User Interface
WinUI: Windows UI Library
XAML: Extensible Application Markup Language
Third-Party Licenses
Open Source Components:
- ClosedXML - MIT License
- LiveCharts - MIT License
- QuestPDF - Community License / Commercial License
- SQLite - Public Domain
- Additional NuGet packages - Various licenses
Commercial Components:
- .NET 8 - Microsoft
- WinUI 3 - Microsoft
- Windows App SDK - Microsoft
All third-party licenses are included in the installation and comply with respective terms.